
Page 73 - Read Online
P. 73
Johnson et al. Art Int Surg 2024;4:401-10 https://dx.doi.org/10.20517/ais.2024.40 Page 403
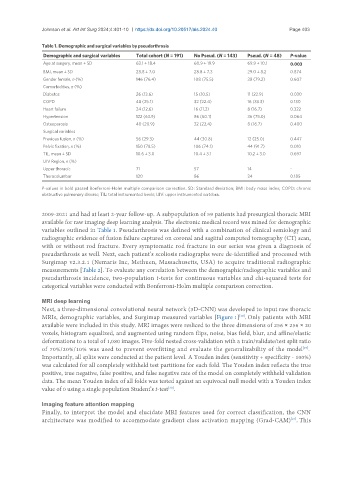
Table 1. Demographic and surgical variables by pseudarthrosis
Demographic and surgical variables Total cohort (N = 191) No Pseud. (N = 143) Pseud. (N = 48) P-value
Age at surgery, mean ± SD 63.1 ± 18.4 60.9 ± 19.9 69.9 ± 10.1 0.003
BMI, mean ± SD 28.8 ± 7.0 28.8 ± 7.3 29.0 ± 8.2 0.874
Gender female, n (%) 146 (76.4) 108 (75.5) 38 (79.2) 0.607
Comorbidities, n (%)
Diabetes 26 (13.6) 15 (10.5) 11 (22.9) 0.030
COPD 48 (25.1) 32 (22.4) 16 (33.3) 0.130
Heart failure 24 (12.6) 16 (11.2) 8 (16.7) 0.322
Hypertension 122 (63.9) 86 (60.1) 36 (75.0) 0.064
Osteoporosis 40 (20.9) 32 (22.4) 8 (16.7) 0.400
Surgical variables
Previous fusion, n (%) 56 (29.3) 44 (30.8) 12 (25.0) 0.447
Pelvic fixation, n (%) 150 (78.5) 106 (74.1) 44 (91.7) 0.010
TIL, mean ± SD 10.6 ± 3.0 10.4 ± 3.1 10.2 ± 3.0 0.697
UIV Region, n (%)
Upper thoracic 71 57 14 -
Thoracolumbar 120 86 34 0.185
P-values in bold passed Bonferroni-Holm multiple comparison correction. SD: Standard deviation; BMI: body mass index; COPD: chronic
obstructive pulmonary disease; TIL: total instrumented levels; UIV: upper instrumented vertebra.
2009-2021 and had at least 2-year follow-up. A subpopulation of 59 patients had presurgical thoracic MRI
available for raw imaging deep learning analysis. The electronic medical record was mined for demographic
variables outlined in Table 1. Pseudarthrosis was defined with a combination of clinical semiology and
radiographic evidence of fusion failure captured on coronal and sagittal computed tomography (CT) scan,
with or without rod fracture. Every symptomatic rod fracture in our series was given a diagnosis of
pseudarthrosis as well. Next, each patient’s scoliosis radiographs were de-identified and processed with
Surgimap v2.3.2.1 (Nemaris Inc, Methuen, Massachusetts, USA) to acquire traditional radiographic
measurements [Table 2]. To evaluate any correlation between the demographic/radiographic variables and
pseudarthrosis incidence, two-population t-tests for continuous variables and chi-squared tests for
categorical variables were conducted with Bonferroni-Holm multiple comparison correction.
MRI deep learning
Next, a three-dimensional convolutional neural network (3D-CNN) was developed to input raw thoracic
MRIs, demographic variables, and Surgimap measured variables [Figure 1] . Only patients with MRI
[18]
available were included in this study. MRI images were resliced to the three dimensions of 256 × 256 × 20
voxels, histogram equalized, and augmented using random flips, noise, bias field, blur, and affine/elastic
deformations to a total of 1,080 images. Five-fold nested cross-validation with a train/validate/test split ratio
of 70%/20%/10% was used to prevent overfitting and evaluate the generalizability of the model .
[19]
Importantly, all splits were conducted at the patient level. A Youden index (sensitivity + specificity - 100%)
was calculated for all completely withheld test partitions for each fold. The Youden index reflects the true
positive, true negative, false positive, and false negative rate of the model on completely withheld validation
data. The mean Youden index of all folds was tested against an equivocal null model with a Youden index
value of 0 using a single population Student’s t-test .
[20]
Imaging feature attention mapping
Finally, to interpret the model and elucidate MRI features used for correct classification, the CNN
architecture was modified to accommodate gradient class activation mapping (Grad-CAM) . This
[21]