
Page 345 - Read Online
P. 345
Zhang et al. Microstructures 2023;3:2023046 https://dx.doi.org/10.20517/microstructures.2023.57 Page 7 of 11
Table 1. Local switching properties of the three types of domain structures
Type V i-SSPFM (V) V i-map (V) V c-SSPFM (V) V c-map (V)
Type 1 -0.6 -1.28 7.1 7
Type 2 -3.55 -3.5 13.77 14
Type 3 -0.95 1.5 11.9 11.5
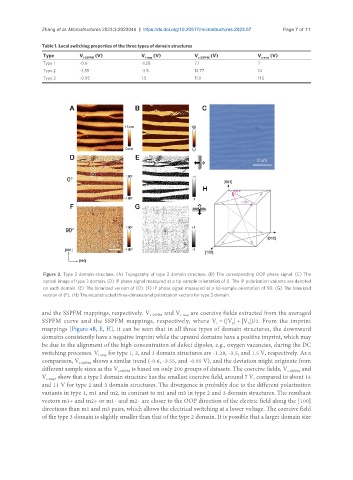
Figure 3. Type 3 domain structure. (A) Topography of type 3 domain structure. (B) The corresponding OOP phase signal. (C) The
optical image of type 3 domain. (D) IP phase signal measured at a tip-sample orientation of 0. The IP polarization variants are denoted
on each domain. (E) The binarized version of (D). (F) IP phase signal measured at a tip-sample orientation of 90. (G) The binarized
version of (F). (H) The reconstructed three-dimensional polarization vectors for type 3 domain.
and the SSPFM mappings, respectively. V c-SSPFM and V c-map are coercive fields extracted from the averaged
SSPFM curve and the SSPFM mappings, respectively, where V = (|V | + |V |)/2. From the imprint
p
c
n
mappings [Figure 4B, E, H], it can be seen that in all three types of domain structures, the downward
domains consistently have a negative imprint while the upward domains have a positive imprint, which may
be due to the alignment of the high concentration of defect dipoles, e.g., oxygen vacancies, during the DC
switching processes. V i-map for type 1, 2, and 3 domain structures are -1.28, -3.5, and 1.5 V, respectively. As a
comparison, V i-SSPFM shows a similar trend (-0.6, -3.55, and -0.95 V), and the deviation might originate from
different sample sizes as the V i-SSPFM is based on only 200 groups of datasets. The coercive fields, V c-SSPFM and
V c-map , show that a type I domain structure has the smallest coercive field, around 7 V, compared to about 14
and 11 V for type 2 and 3 domain structures. The divergence is probably due to the different polarization
variants in type 1, m1 and m2, in contrast to m1 and m3 in type 2 and 3 domain structures. The resultant
vectors m1+ and m2+ or m1- and m2- are closer to the OOP direction of the electric field along the [100]
directions than m1 and m3 pairs, which allows the electrical switching at a lower voltage. The coercive field
of the type 3 domain is slightly smaller than that of the type 2 domain. It is possible that a larger domain size