
Page 20 - Read Online
P. 20
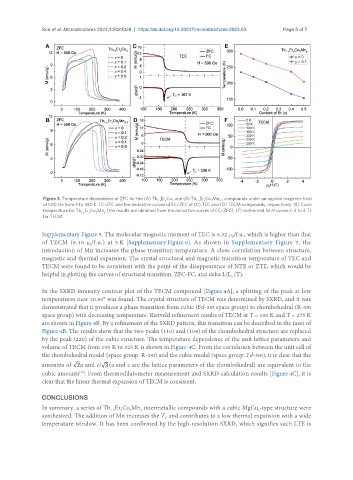
Sun et al. Microstructures 2023;3:2023028  https://dx.doi.org/10.20517/microstructures.2023.03  Page 5 of 7


                Figure 3. Temperature dependence of ZFC for the (A) Tb Er Co  and (B) Tb Er Co Mn  compounds under an applied magnetic field
                                                           2
                                                         x
                                                      1-x
                                                                   1-x
                                                                           0.1
                                                                        2
                                                                      x
                of 500 Oe from 5 to 380 K. FC-ZFC and the derivative curves of FC/ZFC of (C) TEC and (D) TECM compounds, respectively. (E) Curie
                temperature for Tb Er Co Mn  (the results are obtained from the derivative curves of FC/ZFC). (F) Isothermal M-H curves (-4 to 4 T)
                            1-x
                               x
                                    y
                                 2
                for TECM.
               Supplementary Figure 5. The molecular magnetic moment of TEC is 6.32 μ /f.u., which is higher than that
                                                                               B
               of TECM (6.10  μ /f.u.) at 5 K [Supplementary Figure 6]. As shown in Supplementary Figure 7, the
                               B
               introduction of Mn increases the phase transition temperature. A close correlation between structure,
               magnetic and thermal expansion. The crystal structural and magnetic transition temperature of TEC and
               TECM were found to be consistent with the point of the disappearance of NTE or ZTE, which would be
               helpful in plotting the curves of structural transition, ZFC-FC, and delta L/L  (T).
                                                                               0
               In the SXRD intensity contour plot of the TECM compound [Figure 4A], a splitting of the peak at low
               temperatures near 20.85° was found. The crystal structure of TECM was determined by SXRD, and it was
               demonstrated that it produces a phase transition from cubic (Fd-3m space group) to rhombohedral (R-3m
               space group) with decreasing temperature. Rietveld refinement results of TECM at T = 100 K and T = 275 K
               are shown in Figure 4B. By a refinement of the SXRD pattern, this transition can be described in the inset of
               Figure 4B. The results show that the two peaks (110) and (104) of the rhombohedral structure are replaced
               by the peak (220) of the cubic structure. The temperature dependence of the unit lattice parameters and
               volume of TECM from 100 K to 325 K is shown in Figure 4C. From the correlation between the unit cell of
               the rhombohedral model (space group: R-3m) and the cubic model (space group: Fd-3m), it is clear that the
               amounts of  a and c/  (a and c are the lattice parameters of the rhombohedral) are equivalent to the
                            [30]
               cubic amounts . From thermodilatometer measurement and SXRD calculation results [Figure 4C], it is
               clear that the linear thermal expansion of TECM is consistent.

               CONCLUSIONS
               In summary, a series of Tb Er Co Mn  intermetallic compounds with a cubic MgCu -type structure were
                                             2
                                          x
                                      1-x
                                                y
                                                                                        2
               synthesized. The addition of Mn increases the T  and contributes to a low thermal expansion with a wide
                                                         C
               temperature window. It has been confirmed by the high-resolution SXRD, which signifies such LTE is