
Page 72 - Read Online
P. 72
Liu et al. Microstructures 2023;3:2023020 https://dx.doi.org/10.20517/microstructures.2023.02 Page 7 of 27
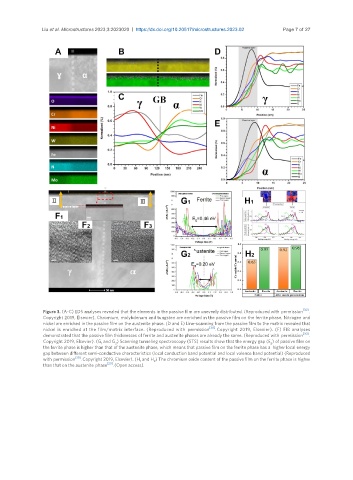
Figure 3. (A-C) EDS analyses revealed that the elements in the passive film are unevenly distributed. (Reproduced with permission [30] .
Copyright 2019, Elsevier). Chromium, molybdenum and tungsten are enriched in the passive film on the ferrite phase. Nitrogen and
nickel are enriched in the passive film on the austenite phase. (D and E) Line-scanning from the passive film to the matrix revealed that
nickel is enriched at the film/matrix interface. (Reproduced with permission [30] . Copyright 2019, Elsevier). (F) FIB analyses
demonstrated that the passive film thicknesses of ferrite and austenite phases are already the same. (Reproduced with permission [30] .
Copyright 2019, Elsevier). (G and G ) Scanning tunneling spectroscopy (STS) results show that the energy gap (E ) of passive film on
1 2 g
the ferrite phase is higher than that of the austenite phase, which means that passive film on the ferrite phase has a higher local energy
gap between different semi-conductive characteristics (local conduction band potential and local valence band potential) (Reproduced
with permission [30] . Copyright 2019, Elsevier). (H and H ) The chromium oxide content of the passive film on the ferrite phase is higher
1 2
than that on the austenite phase [29] . (Open access).