
Page 346 - Read Online
P. 346
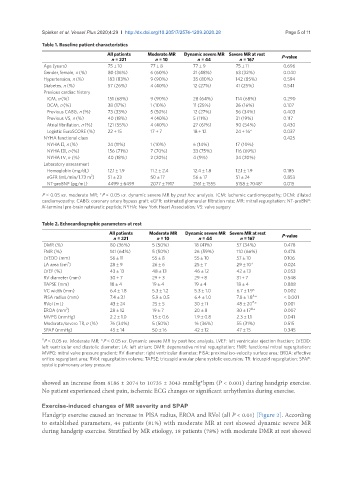
Spieker et al. Vessel Plus 2020;4:29  I  http://dx.doi.org/10.20517/2574-1209.2020.28                                               Page 5 of 11

               Table 1. Baseline patient characteristics
                                     All patients  Moderate MR  Dynamic severe MR  Severe MR at rest
                                       n = 221       n = 10         n = 44        n = 167       P-value
                Age (years)          75 ± 10        77 ± 8        77 ± 9         75 ± 11         0.696
                Gender, female, n (%)  80 (36%)     6 (60%)       21 (48%)       53 (32%)        0.040
                Hypertension, n (%)  183 (83%)      9 (90%)       35 (80%)       142 (85%)       0.594
                Diabetes, n (%)      57 (26%)       4 (40%)       12 (27%)       41 (25%)        0.541
                Previous cardiac history
                 ICM, n (%)          151 (68%)      9 (90%)       28 (64%)       114 (68%)       0.290
                 DCM, n (%)          38 (17%)       1 (10%)       11 (25%)       26 (16%)        0.107
                 Previous CABG, n (%)  73 (33%)     5 (50%)       12 (27%)       56 (34%)        0.403
                 Previous VS, n (%)  40 (18%)       4 (40%)       5 (11%)        31 (19%)        0.117
                 Atrial fibrillation, n (%)  121 (55%)  4 (40%)   27 (61%)       90 (54%)        0.430
                 Logistic EuroSCORE (%)  22 ± 15    17 ± 7        18 ± 12        24 ± 16*        0.037
                NYHA functional class                                                            0.425
                 NYHA II, n (%)      24 (11%)       1 (10%)       6 (14%)        17 (10%)
                 NYHA III, n (%)     156 (71%)      7 (70%)       33 (75%)       116 (69%)
                 NYHA IV, n (%)      40 (18%)       2 (20%)       4 (9%)         34 (20%)
                Labaratory assessment
                 Hemoglobin (mg/dL)  12.1 ± 1.9     11.2 ± 2.4    12.4 ± 1.8     12.1 ± 1.9      0.185
                                2
                 eGFR (mL/min/1.73 m )  51 ± 23     50 ± 17       56 ± 17        51 ± 24         0.853
                 NT-proBNP (pg/mL)   4499 ± 6499    2077 ± 1917   2161 ± 1555    5158 ± 7048*    0.015
               P < 0.05 vs. moderate MR; *P < 0.05 vs. dynamic severe MR by post hoc analysis. ICM: ischemic cardiomyopathy; DCM: dilated
               cardiomyopathy; CABG: coronary artery bypass graft; eGFR: estimated glomerular filtration rate; MR: mitral regurgitation; NT-proBNP:
               N-terminal pro-brain natriuretic peptide; NYHA: New York Heart Association; VS: valve surgery

               Table 2. Echocardiographic parameters at rest
                                      All patients  Moderate MR  Dynamic severe MR Severe MR at rest
                                       n = 221        n = 10        n = 44        n = 167       P-value
                DMR (%)               80 (36%)      5 (50%)        18 (41%)      57 (34%)        0.478
                FMR (%)               141 (64%)     5 (50%)        26 (59%)      110 (66%)       0.478
                LVEDD (mm)            56 ± 11       55 ± 8         55 ± 10       57 ± 10         0.106
                        2
                LA area (cm )         28 ± 9        26 ± 6         25 ± 7        29 ± 10*        0.024
                LVEF (%)              43 ± 13       48 ± 13        46 ± 12       42 ± 13         0.053
                RV diameter (mm)      30 ± 7        29 ± 3         29 ± 8        31 ± 7          0.548
                TAPSE (mm)            18 ± 4        19 ± 4         19 ± 4        18 ± 4          0.888
                VC width (mm)         6.4 ± 1.8     5.3 ± 1.2      5.3 ± 1.0     6.7 ± 1.9*      0.002
                PISA radius (mm)      7.4 ± 3.1     5.9 ± 0.5      6.4 ± 1.0     7.8 ± 1.8 *     < 0.001
                                                                                      #,
                                                                                      #,
                RVol (mL)             43 ± 24       25 ± 5         30 ± 11       48 ± 20 *       0.001
                                                                                      #,
                       2
                EROA (mm )            28 ± 12       19 ± 7         20 ± 8        30 ± 17 *       0.007
                MVPG (mmHg)           2.2 ± 1.0     1.5 ± 0.6      1.9 ± 0.8     2.3 ± 1.1       0.041
                Moderate/severe TR, n (%)  76 (34%)  5 (50%)       16 (36%)      55 (31%)        0.515
                SPAP (mmHg)           45 ± 14       50 ± 16        42 ± 12       47 ± 15         0.345
               # P < 0.05 vs. Moderate MR; *P < 0.05 vs. Dynamic severe MR by post hoc analysis. LVEF: left ventricular ejection fraction; LVEDD:
               left ventricular end diastolic diameter; LA: left atrium; DMR: degenerative mitral regurgitation; FMR: functional mitral regurgitation;
               MVPG: mitral valve pressure gradient; RV diameter: right ventricular diameter; PISA: proximal iso-velocity surface area; EROA: effective
               orifice regurgitant area; RVol: regurgitation volume; TAPSE: tricuspid annular plane systolic excursion; TR: tricuspid regurgitation; SPAP:
               systolic pulmonary artery pressure


               showed an increase from 8186 ± 2074 to 10735 ± 3043 mmHg*bpm (P < 0.001) during handgrip exercise.
               No patient experienced chest pain, ischemic ECG changes or significant arrhythmias during exercise.

               Exercise-induced changes of MR severity and SPAP
               Handgrip exercise caused an increase in PISA radius, EROA and RVol (all P < 0.01) [Figure 2]. According
               to established parameters, 44 patients (81%) with moderate MR at rest showed dynamic severe MR
               during handgrip exercise. Stratified by MR etiology, 18 patients (78%) with moderate DMR at rest showed