
Page 56 - Read Online
P. 56
Sazonova et al. Vessel Plus 2019;3:5 I http://dx.doi.org/10.20517/2574-1209.2018.56 Page 5 of 9
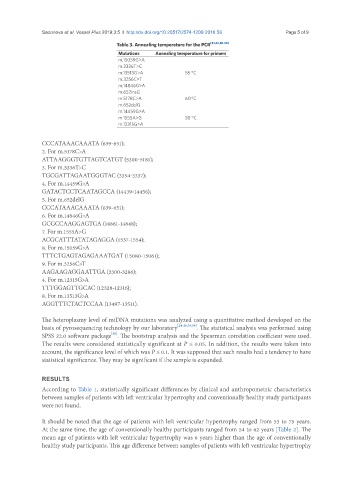
Table 3. Annealing temperature for the PCR [24,26,28-30]
Mutations Annealing temperature for primers
m.15059G>A
m.3336T>C
m.13513G>A 55 °C
m.3256C>T
m.14846G>A
m.652insG
m.5178C>A 60°C
m.652delG
m.14459G>A
m.1555A>G 50 °C
m.12315G>A
CCCATAAACAAATA (639-651);
2. For m.5178C>A
ATTAAGGGTGTTAGTCATGT (5200-5181);
3. For m.3336T>C
TGCGATTAGAATGGGTAC (3354-3337);
4. For m.14459G>A
GATACTCCTCAATAGCCA (14439-14456);
5. For m.652delG
CCCATAAACAAATA (639-651);
6. For m.14846G>A
GCGCCAAGGAGTGA (14861-14848);
7. For m.1555A>G
ACGCATTTATATAGAGGA (1537-1554);
8. For m.15059G>A
TTTCTGAGTAGAGAAATGAT (15080-15061);
9. For m.3256C>T
AAGAAGAGGAATTGA (3300-3286);
4. For m.12315G>A
TTTGGAGTTGCAC (12328-12316);
8. For m.13513G>A
AGGTTTCTACTCCAA (13497-13511).
The heteroplasmy level of mtDNA mutations was analyzed using a quantitative method developed on the
basis of pyrosequencing technology by our laboratory [24-26,38,39] . The statistical analysis was performed using
[40]
SPSS 22.0 software package . The bootstrap analysis and the Spearman correlation coefficient were used.
The results were considered statistically significant at P ≤ 0.05. In addition, the results were taken into
account, the significance level of which was P ≤ 0.1. It was supposed that such results had a tendency to have
statistical significance. They may be significant if the sample is expanded.
RESULTS
According to Table 1, statistically significant differences by clinical and anthropometric characteristics
between samples of patients with left ventricular hypertrophy and conventionally healthy study participants
were not found.
It should be noted that the age of patients with left ventricular hypertrophy ranged from 53 to 75 years.
At the same time, the age of conventionally healthy participants ranged from 54 to 62 years [Table 2]. The
mean age of patients with left ventricular hypertrophy was 6 years higher than the age of conventionally
healthy study participants. This age difference between samples of patients with left ventricular hypertrophy