
Page 55 - Read Online
P. 55
Page 4 of 9 Sazonova et al. Vessel Plus 2019;3:5 I http://dx.doi.org/10.20517/2574-1209.2018.56
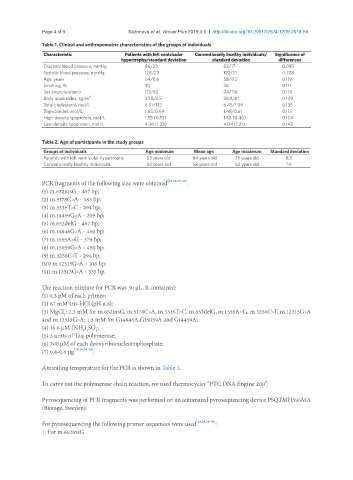
Table 1. Clinical and anthropometric characteristics of the groups of individuals
Characteristic Patients with left ventricular Conventionally healthy individuals/ Significance of
hypertrophy/standard deviation standard deviation differences
Diastolic blood pressure, mmHg 86/23 83/17 0.395
Systolic blood pressure, mmHg 128/23 122/21 0.228
Age, years 64/8.6 58/8.2 0.119
Smoking, % 35 28 0.111
Sex (man/women) 112/82 94/116 0.118
Body mass index, kg/m 2 33.8/4.5 28.9/4.1 0.149
Total cholesterol, mol/L 6.51/1.12 6.45/1.05 0.135
Triglycerides, mol/L 1.65/0.64 1.48/0.61 0.115
High-density lipoprotein, mol/L 1.55 (0.53) 1.68 (0.44) 0.104
Low-density lipoprotein, mol/L 4.36 (1.23) 4.04 (1.21) 0.142
Table 2. Age of participants in the study groups
Groups of individuals Age minimum Mean age Age maximum Standard deviation
Patients with left ventricular hypertrophy 53 years old 64 years old 75 years old 8.3
Conventionally healthy individuals 54 years old 58 years old 62 years old 7.9
PCR fragments of the following size were obtained [24,26,28-30] :
(1) m.652insG - 467 bp;
(2) m.5178C>A - 383 bp;
(3) m.3336T>C - 294 bp;
(4) m.14459G>A - 209 bp;
(5) m.652delG - 467 bp;
(6) m.14846G>A - 450 bp;
(7) m.1555A>G - 379 bp;
(8) m.15059G>A - 450 bp;
(9) m.3256C>T - 294 bp;
(10) m.12315G>A - 108 bp;
(11) m.13513G>A - 335 bp.
The reaction mixture for PCR was 30 µL. It contained:
(1) 0.3 pM of each primer;
(2) 67 mM tris-HCl (pH 8.8);
(3) MgCl : 2.5 mM for m.652insG, m.5178C>A, m.3336T>C, m.652delG, m.1555A>G, m.3256C>T, m.12315G>A
2
and m.13513G>A; 1.5 mM for G14846A,G15059A and G14459A;
(4) 16.6 µM (NH ) SO ;
4
4 2
(5) 3 units of Taq-polymerase;
(6) 200 µM of each deoxyribonucleotriphosphate;
(7) 0.4-0.6 µg [24,26,28-30] .
Annealing temperature for the PCR is shown in Table 3.
To carry out the polymerase chain reaction, we used thermocycler “PTC DNA Engine 200”.
Pyrosequencing of PCR fragments was performed on an automated pyrosequencing device PSQTMHS96MA
(Biotage, Sweden).
For pyrosequencing the following primer sequences were used [24,26,28-30] :
1. For m.652insG