
Page 253 - Read Online
P. 253
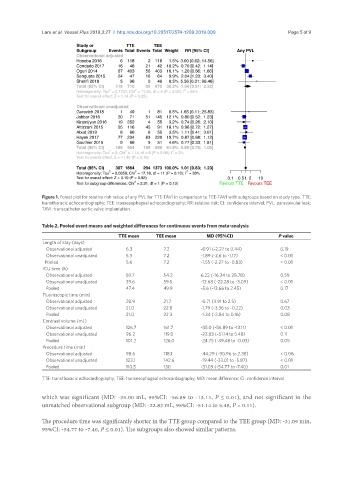
Lam et al. Vessel Plus 2019;3:27  I  http://dx.doi.org/10.20517/2574-1209.2019.009                                                        Page 5 of 9


               Figure 1. Forest plot for relative risk ratios of any PVL for TTE-TAVI in comparison to TEE-TAVI with subgroups based on study type. TTE;
               transthoracic echocardiography; TEE: transesophageal echocardiography; RR: relative risk; CI: confidence interval; PVL: paravalvular leak;
               TAVI: transcatheter aortic valve implantation


               Table 2. Pooled event means and weighted differences for continuous events from meta-analysis
                                         TTE mean     TEE mean         MD (95%CI)              P value
               Length of stay (days)
                  Observational adjusted    6.3         7.2          -0.91 (-2.27 to 0.44)      0.19
                  Observational unadjusted  5.3         7.2          -1.89 (-2.6 to -1.17)      < 0.01
                 Pooled                     5.6         7.2          -1.55 (-2.27 to -0.83)     < 0.01
               ICU time (h)
                  Observational adjusted    59.7        54.2         6.22 (-16.34 to 28.78)     0.59
                  Observational unadjusted  39.6        59.5         -12.68 (-22.28 to -3.09)   < 0.01
                  Pooled                    47.4        49.9         -5.6 (-13.66 to 2.45)      0.17
               Fluoroscopic time (min)
                  Observational adjusted    20.9        21.7         -0.71 (3.91 to 2.5)        0.67
                  Observational unadjusted  21.0        22.8         -1.79 (-3.36 to -0.22)     0.03
                  Pooled                    21.0        22.3         -1.34 (-2.84 to 0.16)      0.08
               Contrast volume (mL)
                  Observational adjusted    126.7       161.7        -35.0 (-56.89 to -13.11)   < 0.01
                  Observational unadjusted  96.2        119.0        -22.83 (-51.14 to 5.48)    0.11
                  Pooled                    101.2       126.0        -24.75 (-49.48 to -0.03)   0.05
               Procedure time (min)
                  Observational adjusted    98.6        118.1        -44.29 (-90.96 to 2.38)    < 0.06
                  Observational unadjusted  123.1       142.6        -19.44 (-33.01 to -5.87)   < 0.01
                  Pooled                    110.5       130          -31.09 (-54.77 to -7.40)   0.01

               TTE: transthoracic echocardiography; TEE: transesophageal echocardiography; MD: mean difference; CI: confidence interval

               which was significant (MD: -35.00 mL, 95%CI: -56.89 to -13.11, P ≤ 0.01), and not significant in the
               unmatched observational subgroup (MD: -22.83 mL, 95%CI: -51.14 to 5.48, P = 0.11).


               The procedure time was significantly shorter in the TTE group compared to the TEE group (MD: -31.09 min,
               95%CI: -54.77 to -7.40, P ≤ 0.01). The subgroups also showed similar patterns.