
Page 252 - Read Online
P. 252
Page 4 of 9 Lam et al. Vessel Plus 2019;3:27 I http://dx.doi.org/10.20517/2574-1209.2019.009
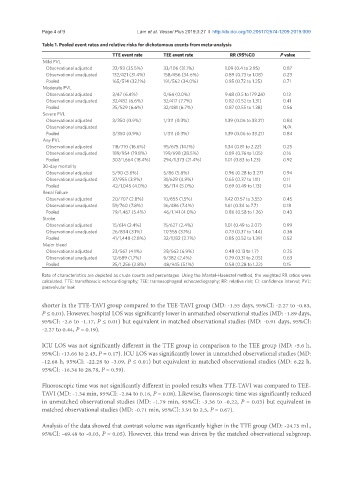
Table 1. Pooled event rates and relative risks for dichotomous events from meta-analysis
TTE event rate TEE event rate RR (95%CI) P value
Mild PVL
Observational adjusted 33/93 (35.5%) 33/106 (31.1%) 1.09 (0.4 to 2.95) 0.87
Observational unadjusted 132/421 (31.4%) 158/456 (34.6%) 0.89 (0.73 to 1.08) 0.23
Pooled 165/514 (32.1%) 191/562 (34.0%) 0.95 (0.72 to 1.25) 0.71
Moderate PVL
Observational adjusted 3/47 (6.4%) 0/64 (0.0%) 9.48 (0.5 to 179.24) 0.13
Observational unadjusted 32/482 (6.6%) 32/417 (7.7%) 0.82 (0.52 to 1.31) 0.41
Pooled 35/529 (6.6%) 32/481 (6.7%) 0.87 (0.55 to 1.38) 0.56
Severe PVL
Observational adjusted 3/350 (0.9%) 1/311 (0.3%) 1.39 (0.06 to 33.21) 0.84
Observational unadjusted N/A
Pooled 3/350 (0.9%) 1/311 (0.3%) 1.39 (0.06 to 33.21) 0.84
Any PVL
Observational adjusted 118/710 (16.6%) 95/675 (14.1%) 1.34 (0.81 to 2.22) 0.25
Observational unadjusted 189/954 (19.8%) 199/698 (28.5%) 0.89 (0.76 to 1.05) 0.16
Pooled 307/1,664 (18.4%) 294/1,373 (21.4%) 1.01 (0.83 to 1.23) 0.92
30-day mortality
Observational adjusted 5/90 (5.6%) 5/86 (5.8%) 0.96 (0.28 to 3.27) 0.94
Observational unadjusted 37/955 (3.9%) 31/628 (4.9%) 0.65 (0.37 to 1.11) 0.11
Pooled 42/1,045 (4.0%) 36/714 (5.0%) 0.69 (0.49 to 1.13) 0.14
Renal Failure
Observational adjusted 20/707 (2.8%) 10/655 (1.5%) 1.42 (0.57 to 3.55) 0.45
Observational unadjusted 59/760 (7.8%) 36/486 (7.4%) 1.61 (0.34 to 7.7) 0.18
Pooled 79/1,467 (5.4%) 46/1,141 (4.0%) 0.86 (0.58 to 1.26) 0.43
Stroke
Observational adjusted 15/614 (2.4%) 15/627 (2.4%) 1.01 (0.49 to 2.07) 0.99
Observational unadjusted 26/834 (3.1%) 17/555 (3.1%) 0.73 (0.37 to 1.44) 0.36
Pooled 41/1,448 (2.8%) 32/1,182 (2.7%) 0.85 (0.52 to 1.39) 0.52
Major bleed
Observational adjusted 23/567 (4.1%) 39/563 (6.9%) 0.48 (0.13 to 1.7) 0.25
Observational unadjusted 12/689 (1.7%) 9/382 (2.4%) 0.79 (0.31 to 2.05) 0.63
Pooled 35/1,256 (2.8%) 48/945 (5.1%) 0.58 (0.28 to 1.22) 0.15
Rate of characteristics are depicted as crude counts and percentages. Using the Mantel-Haenszel method, the weighted RR ratios were
calculated. TTE: transthoracic echocardiography; TEE: transesophageal echocardiography; RR: relative risk; CI: confidence interval; PVL:
paravalvular leak
shorter in the TTE-TAVI group compared to the TEE-TAVI group (MD: -1.55 days, 95%CI: -2.27 to -0.83,
P ≤ 0.01). However, hospital LOS was significantly lower in unmatched observational studies (MD: -1.89 days,
95%CI: -2.6 to -1.17, P ≤ 0.01) but equivalent in matched observational studies (MD: -0.91 days, 95%CI:
-2.27 to 0.44, P = 0.19).
ICU LOS was not significantly different in the TTE group in comparison to the TEE group (MD: -5.6 h,
95%CI: -13.66 to 2.45, P = 0.17). ICU LOS was significantly lower in unmatched observational studies (MD:
-12.68 h, 95%CI: -22.28 to -3.09, P ≤ 0.01) but equivalent in matched observational studies (MD: 6.22 h,
95%CI: -16.34 to 28.78, P = 0.59).
Fluoroscopic time was not significantly different in pooled results when TTE-TAVI was compared to TEE-
TAVI (MD: -1.34 min, 95%CI: -2.84 to 0.16, P = 0.08). Likewise, fluoroscopic time was significantly reduced
in unmatched observational studies (MD: -1.79 min, 95%CI: -3.36 to -0.22, P = 0.03) but equivalent in
matched observational studies (MD: -0.71 min, 95%CI: 3.91 to 2.5, P = 0.67).
Analysis of the data showed that contrast volume was significantly higher in the TTE group (MD: -24.75 mL,
95%CI: -49.48 to -0.03, P = 0.05). However, this trend was driven by the matched observational subgroup,