
Page 144 - Read Online
P. 144
Sobenin et al. Vessel Plus 2019;3:14 I http://dx.doi.org/10.20517/2574-1209.2018.63 Page 5 of 10
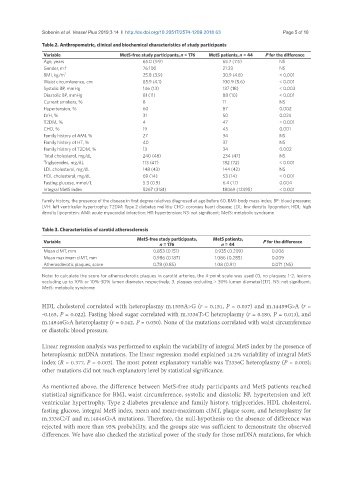
Table 2. Anthropometric, clinical and biochemical characteristics of study participants
Variable MetS-free study participants, n = 176 MetS patients, n = 44 P for the difference
Age, years 65.0 (9.9) 65.7 (7.5) NS
Gender, m:f 76:100 21:23 NS
BMI, kg/m 2 25.8 (3.9) 30.9 (4.8) < 0.001
Waist circumference, cm 85.9 (4.1) 100.9 (5.6) < 0.001
Systolic BP, mmHg 146 (13) 137 (18) < 0.003
Diastolic BP, mmHg 81 (11) 88 (10) < 0.001
Current smokers, % 8 11 NS
Hypertension, % 60 87 0.002
LVH, % 31 50 0.024
T2DM, % 4 47 < 0.001
CHD, % 19 45 0.001
Family history of AMI, % 27 34 NS
Family history of HT, % 40 37 NS
Family history of T2DM, % 13 34 0.002
Total cholesterol, mg/dL 240 (48) 234 (47) NS
Triglycerides, mg/dL 113 (47) 182 (72) < 0.001
LDL cholesterol, mg/dL 148 (43) 144 (42) NS
HDL cholesterol, mg/dL 69 (14) 53 (14) < 0.001
Fasting glucose, mmol/L 5.3 (0.9) 6.4 (1.1) 0.004
Integral MetS index 5267 (3181) 18069 (12495) < 0.001
Family history, the presence of the disease in first degree relatives diagnosed at age before 60. BMI: body mass index; BP: blood pressure;
LVH: left ventricular hypertrophy; T2DM: Type 2 diabetes mellitis; CHD: coronary heart disease; LDL: low density lipoprotein; HDL: high
density lipoprotein; AMI: acute myocardial infarction; HT: hypertension; NS: not significant; MetS: metabolic syndrome
Table 3. Characteristics of carotid atherosclerosis
MetS-free study participants, MetS patients,
Variable P for the difference
n = 176 n = 44
Mean cIMT, mm 0.853 (0.151) 0.935 (0.209) 0.006
Mean maximum cIMT, mm 0.986 (0.187) 1.086 (0.285) 0.009
Atherosclerotic plaques, score 0.78 (0.85) 1.08 (0.91) 0.071 (NS)
Note: to calculate the score for atherosclerotic plaques in carotid arteries, the 4-point scale was used (0, no plaques; 1-2, lesions
occluding up to 10% or 10%-30% lumen diameter, respectively; 3, plaques occluding > 30% lumen diameter)[17]. NS: not significant;
MetS: metabolic syndrome
HDL cholesterol correlated with heteroplasmy m.1555A>G (r = 0.151, P = 0.037) and m.14459G>A (r =
-0.165, P = 0.022). Fasting blood sugar correlated with m.3336T>C heteroplasmy (r = 0.180, P = 0.013), and
m.14846G>A heteroplasmy (r = 0.142, P = 0.050). None of the mutations correlated with waist circumference
or diastolic blood pressure.
Linear regression analysis was performed to explain the variability of integral MetS index by the presence of
heteroplasmic mtDNA mutations. The linear regression model explained 14.2% variability of integral MetS
index (R = 0.377, P = 0.003). The most potent explanatory variable was T3336C heteroplasmy (P = 0.003);
other mutations did not reach explanatory level by statistical significance.
As mentioned above, the difference between MetS-free study participants and MetS patients reached
statistical significance for BMI, waist circumference, systolic and diastolic BP, hypertension and left
ventricular hypertrophy, Type 2 diabetes prevalence and family history, triglycerides, HDL cholesterol,
fasting glucose, integral MetS index, mean and mean-maximum cIMT, plaque score, and heteroplasmy for
m.3336C>T and m.14846G>A mutations. Therefore, the null-hypothesis on the absence of difference was
rejected with more than 95% probability, and the groups size was sufficient to demonstrate the observed
differences. We have also checked the statistical power of the study for those mtDNA mutations, for which