
Page 143 - Read Online
P. 143
Page 4 of 10 Sobenin et al. Vessel Plus 2019;3:14 I http://dx.doi.org/10.20517/2574-1209.2018.63
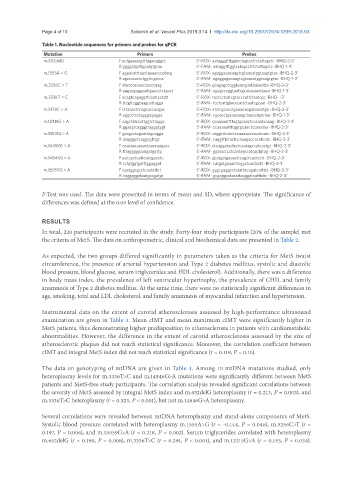
Table 1. Nucleotide sequences for primers and probes for qPCR
Mutation Primers Probes
m.652delG F actgaaaatgtttagacgggct 5’-ROX- aatagggtttggtcctagcctttctattagctc -BHQ-2-3’
R ggggatgcttgcatgtgtaa 5’-FAM- aataggtttggtcctagcctttctattagctc -BHQ-1-3’
m.1555A > G F aggacatttaactaaaacccctacg 5’-ROX- agaggaaacaagtcgtaacatggtaagtgtac -BHQ-2-3’
R agctacactctggttcgtcca 5’-FAM- agaggagacaagtcgtaacatggtaagtgtac -BHQ-1-3’
m.3256C > T F atacccacacccacccaag 5’-ROX- gcagagcccggtaatcgtataaaactta -BHQ-2-3’
R aagaagaggaattgaacctctgact 5’-FAM- agagcccggtaatcgcataaaacttaaa -BHQ-1-3’
m.3336T > C F acagtcagaggttcaattcctctt 5’-ROX- tactcctcatcgtacccattctaatcgc -BHQ- -3’
R ttcgttcggtaagcattagga 5’-FAM- tcctcattgtacccattctaatcgcaat -BHQ-2-3’
m.5178C > A F cttaaactccagcaccacgac 5’-ROX- atctcgcacctgaaacaagataacatga -BHQ-2-3’
R aggcctcctagggagagga 5’-FAM- cgcacctgaaacaagctaacatgactaa -BHQ-1-3’
m.12315G > A F cagctatccattggtcttaggc 5’-ROX- ccaaaaattttagtgcaactccaaataaaag -BHQ-2-3’
R ggaagtcagggttagggtggt 5’-FAM- ccaaaaattttggtgcaactccaaataa -BHQ-2-3’
m.13513G > A F gcagcctagcattagcagga 5’-ROX- caggtttctactccaaaaaccacatcatc -BHQ-2-3’
R atagggctcaggcgtttgt 5’-FAM- caggtttctactccaaagaccacatcatc -BHQ-2-3’
m.14459G > A F ccactaaaacactcaccaagacc 5’-ROX- ctcaggatactcctcaatagccatcactgt -BHQ-2-3’
R tttagggggaatgatggttg 5’-FAM- ggatactcctcaatagccatcgctgtag -BHQ-2-3’
m.14846G > A F aaccactcattcatcgacctc 5’-ROX- gcatgatgaaacttcagctcactcctt -BHQ-2-3’
R cctgtggtgatttggaggat 5’-FAM- catgatgaaacttcggctcactcctt -BHQ-2-3’
m.15059G > A F caatggcgcctcaatattct 5’-ROX- gggcgaggcctatattacagatcatttct -BHQ-2-3’
R caggaggataatgccgatgt 5’-FAM- gcgaggcctatattacggatcatttctc -BHQ-2-3’
F-Test was used. The data were presented in terms of mean and SD, where appropriate. The significance of
differences was defined at the 0.05 level of confidence.
RESULTS
In total, 220 participants were recruited in the study. Forty-four study participants (20% of the sample) met
the criteria of MetS. The data on anthropometric, clinical and biochemical data are presented in Table 2.
As expected, the two groups differed significantly in parameters taken as the criteria for MetS (waist
circumference, the presence of arterial hypertension and Type 2 diabetes mellitus, systolic and diastolic
blood pressure, blood glucose, serum triglycerides and HDL cholesterol). Additionally, there was a difference
in body mass index, the prevalence of left ventricular hypertrophy, the prevalence of CHD, and family
anamnesis of Type 2 diabetes mellitus. At the same time, there were no statistically significant differences in
age, smoking, total and LDL cholesterol, and family anamnesis of myocardial infarction and hypertension.
Instrumental data on the extent of carotid atherosclerosis assessed by high-performance ultrasound
examination are given in Table 3. Mean cIMT and mean maximum cIMT were significantly higher in
MetS patients, thus demonstrating higher predisposition to atherosclerosis in patients with cardiometabolic
abnormalities. However, the difference in the extent of carotid atherosclerosis assessed by the size of
atherosclerotic plaques did not reach statistical significance. Moreover, the correlation coefficient between
cIMT and integral MetS index did not reach statistical significance (r = 0.119, P = 0.10).
The data on genotyping of mtDNA are given in Table 4. Among 10 mtDNA mutations studied, only
heteroplasmy levels for m.3336T>C and m.14846G>A mutations were significantly different between MetS
patients and MetS-free study participants. The correlation analysis revealed significant correlations between
the severity of MetS assessed by integral MetS index and m.652delG heteroplasmy (r = 0.213, P = 0.003), and
m.3336T>C heteroplasmy (r = 0.323, P < 0.001), but not m.14846G>A heteroplasmy.
Several correlations were revealed between mtDNA heteroplasmy and stand-alone components of MetS.
Systolic blood pressure correlated with heteroplasmy m.1555A>G (r = -0.144, P = 0.046), m.3256C>T (r =
0.197, P = 0.006), and m.15059G>A (r = 0.218, P = 0.002). Serum triglycerides correlated with heteroplasmy
m.652delG (r = 0.190, P = 0.008), m.3336T>C (r = 0.291, P < 0.001), and m.12315G>A (r = 0.153, P = 0.034).