Page 384 - Read Online
P. 384

Elsayed et al. Vessel Plus 2018;2:39  I  http://dx.doi.org/10.20517/2574-1209.2018.65                                                  Page 7 of 11

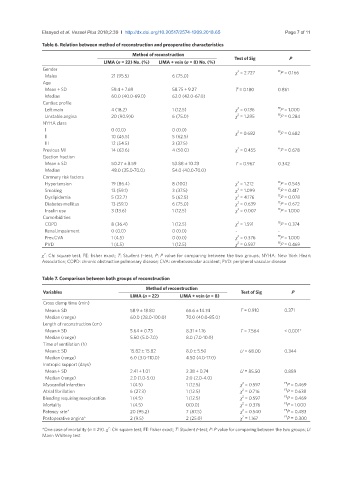
               Table 6. Relation between method of reconstruction and preoperative characteristics
                                              Method of reconstruction          Test of Sig       P
                                    LIMA (n = 22) No. (%)  LIMA + vein (n = 8) No. (%)
               Gender                                                            2             FE
                 Males                 21 (95.5)           6 (75.0)             χ  = 2.727      P = 0.166
               Age
                 Mean ± SD             59.4 ± 7.69         58.75 ± 9.27         T = 0.180      0.861
                 Median                60.0 (40.0-69.0)    62.0 (42.0-67.0)
               Cardiac profile
                                                                                 2
                 Left main             4 (18.2)            1 (12.5)             χ  = 0.136     FE P = 1.000
                                                                                 2
                 Unstable angina       20 (90.9)0          6 (75.0)             χ  = 1.285     FE P = 0.284
               NYHA class
                 I                     0 (0.0)             0 (0.0)               2             FE
                 II                    10 (45.5)           5 (62.5)             χ = 0.682       P = 0.682
                 III                   12 (54.5)           3 (37.5)
                                                                                 2
               Previous MI             14 (63.6)           4 (50.0)             χ  = 0.455     FE P = 0.678
               Ejection fraction
                 Mean ± SD             50.27 ± 8.59        53.88 ± 10.23        T = 0.967      0.342
                 Median                48.0 (35.0-70.0)    54.0 (40.0-70.0)
               Coronary risk factors
                                                                                 2
                 Hypertension          19 (86.4)           8 (100)              χ  = 1.212     FE P = 0.545
                                                                                 2
                 Smoking               13 (59.1)           3 (37.5)             χ  = 1.099     FE P = 0.417
                                                                                 2
                 Dyslipidemia          5 (22.7)            5 (62.5)             χ  = 4.176     FE P = 0.078
                                                                                 2
                 Diabetes mellitus     13 (59.1)           6 (75.0)             χ  = 0.639     FE P = 0.672
                                                                                 2
                 Insulin use           3 (13.6)            1 (12.5)             χ  = 0.007     FE P = 1.000
               Comorbidities
                                                                                 2
                 COPD                  8 (36.4)            1 (12.5)             χ  = 1.591     FE P = 0.374
                 Renal.impairment      0 (0.0)             0 (0.0)              -              -
                                                                                 2
                 Prev.CVA              1 (4.5)             0 (0.0)              χ  = 0.376     FE P = 1.000
                 PVD                   1 (4.5)             1 (12.5)             χ  = 0.597     FE P = 0.469
                                                                                 2
               χ : Chi square test; FE: fisher exact; T: Student t-test; P: P value for comparing between the two groups; NYHA: New York Heart
                2
               Association; COPD: chronic obstructive pulmonary disease; CVA: cerebrovascular accident; PVD: peripheral vascular disease
               Table 7. Comparison between both groups of reconstruction
                                                  Method of reconstruction
                Variables                                                         Test of Sig      P
                                             LIMA (n = 22)    LIMA + vein (n = 8)
                Cross clamp time (min)
                  Mean ± SD                  58.9 ± 18.80       65.6 ± 14.74      T = 0.910      0.371
                  Median (range)             60.0 (28.0-100.0)  70.0 (40.0-85.0)
                Length of reconstruction (cm)
                  Mean ± SD                  5.64 ± 0.73        8.31 ± 1.16       T = 7.564      < 0.001*
                  Median (range)             5.50 (5.0-7.0)     8.0 (7.0-10.0)
                Time of ventilation (h)
                  Mean ± SD                  15.82 ± 15.82      8.0 ± 5.50        U = 68.00      0.344
                  Median (range)             6.0 (3.0-110.0)    4.50 (4.0-17.0)
                Inotropic support (days)
                  Mean ± SD                  2.41 ± 1.01        2.38 ± 0.74       U = 85.50      0.889
                  Median (range)             2.0 (1.0-5.0)      2.0 (2.0-4.0)
                                                                                   2
                Myocardial infarction        1 (4.5)            1 (12.5)          χ  = 0.597     FE P = 0.469
                                                                                   2
                Atrial fibrillation          6 (27.3)           1 (12.5)          χ  = 0.716     FE P = 0.638
                                                                                   2
                Bleeding requiring reexploration  1 (4.5)       1 (12.5)          χ  = 0.597     FE P = 0.469
                                                                                   2
                Mortality                    1 (4.5)            0(0.0)            χ  = 0.376     FE P = 1.000
                                                                                   2
                Patency rate*                20 (95.2)          7 (87.5)          χ  = 0.540     FE P = 0.483
                                                                                   2
                Postoperative angina*        2 (9.5)            2 (25.0)          χ  = 1.167     FE P = 0.300
                                      2
               *One case of mortality (n = 29). χ : Chi square test; FE: fisher exact; T: Student t-test; P: P value for comparing between the two groups; U:
               Mann Whitney test
   379   380   381   382   383   384   385   386   387   388   389