
Page 38 - Read Online
P. 38
Im et al. Vessel Plus 2018;2:5 I http://dx.doi.org/10.20517/2574-1209.2018.07 Page 3 of 7
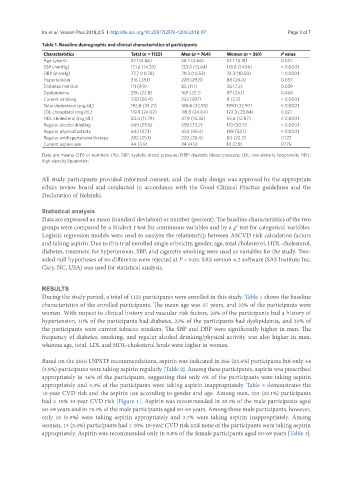
Table 1. Baseline demographic and clinical characteristics of participants
Characteristics Total (n = 1125) Men (n = 764) Women (n = 361) P value
Age (years) 57.1 (4.86) 56.7 (4.66) 57.7 (5.18) 0.001
SBP (mmHg) 121.6 (14.33) 123.0 (13.84) 118.8 (14.96) < 0.0001
DBP (mmHg) 77.7 (10.78) 79.3 (10.53) 74.3 (10.50) < 0.0001
Hypertension 316 (28.1) 228 (29.8) 88 (24.4) 0.057
Diabetes mellitus 111 (9.9) 85 (11.1) 26 (7.2) 0.039
Dyslipidemia 256 (22.8) 169 (22.1) 87 (24.1) 0.460
Current smoking 230 (20.4) 222 (29.1) 8 (2.2) < 0.0001
Total cholesterol (mg/dL) 192.8 (33.21) 189.8 (32.93) 199.1 (32.97) < 0.0001
LDL cholesterol (mg/dL) 119.9 (24.02) 118.8 (24.04) 122.3 (23.84) 0.021
HDL cholesterol (mg/dL) 50.4 (11.79) 47.9 (10.35) 55.6 (12.87) < 0.0001
Regular alcohol drinking 669 (59.5) 559 (73.2) 110 (30.5) < 0.0001
Regular physical activity 642 (57.1) 454 (59.4) 188 (52.1) < 0.0001
Regular antihypertensive therapy 282 (25.1) 202 (26.4) 80 (22.2) 0.122
Current aspirin use 44 (3.9) 34 (4.5) 10 (2.8) 0.175
Data are means (SD) or numbers (%). SBP: systolic blood pressure; DBP: diastolic blood pressure; LDL: low-density lipoprotein; HDL:
high-density lipoprotein
All study participants provided informed consent, and the study design was approved by the appropriate
ethics review board and conducted in accordance with the Good Clinical Practice guidelines and the
Declaration of Helsinki.
Statistical analysis
Data are expressed as mean (standard deviation) or number (percent). The baseline characteristics of the two
groups were compared by a Student t test for continuous variables and by a χ test for categorical variables.
2
Logistic regression models were used to analyze the relationship between ASCVD risk calculation factors
and taking aspirin. Due to this trial enrolled single ethnicity, gender, age, total cholesterol, HDL-cholesterol,
diabetes, treatment for hypertension, SBP, and cigarette smoking were used as variables for the study. Two-
sided null hypotheses of no difference were rejected at P < 0.05. SAS version 4.2 software (SAS Institute Inc,
Cary, NC, USA) was used for statistical analysis.
RESULTS
During the study period, a total of 1125 participants were enrolled in this study. Table 1 shows the baseline
characteristics of the enrolled participants. The mean age was 57 years, and 32% of the participants were
women. With respect to clinical history and vascular risk factors, 28% of the participants had a history of
hypertension, 10% of the participants had diabetes, 23% of the participants had dyslipidemia, and 20% of
the participants were current tobacco smokers. The SBP and DBP were significantly higher in men. The
frequency of diabetes, smoking, and regular alcohol drinking/physical activity was also higher in men,
whereas age, total, LDL and HDL-cholesterol levels were higher in women.
Based on the 2016 USPSTF recommendations, aspirin was indicated in 266 (23.6%) participants but only 44
(3.9%) participants were taking aspirin regularly [Table 2]. Among these participants, aspirin was prescribed
appropriately in 36% of the participants, suggesting that only 6% of the participants were taking aspirin
appropriately and 3.3% of the participants were taking aspirin inappropriately. Table 3 demonstrates the
10-year CVD risk and the aspirin use according to gender and age. Among men, 253 (33.1%) participants
had ≥ 10% 10-year CVD risk [Figure 1]. Aspirin was recommended in 20.1% of the male participants aged
50-59 years and in 75.1% of the male participants aged 60-69 years. Among these male participants, however,
only 15 (5.9%) were taking aspirin appropriately and 3.7% were taking aspirin inappropriately. Among
women, 13 (3.6%) participants had ≥ 10% 10-year CVD risk and none of the participants were taking aspirin
appropriately. Aspirin was recommended only in 9.8% of the female participants aged 60-69 years [Table 3].