
Page 71 - Read Online
P. 71
Bobronnikova Biomarker of metabolic disorders and cardiovascular remodeling
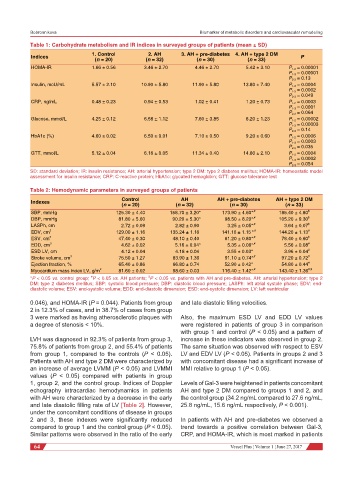
Table 1: Carbohydrate metabolism and IR indices in surveyed groups of patients (mean ± SD)
Indices 1. Control 2. AH 3. AH + pre-diabetes 4. AH + type 2 DM P
(n = 20) (n = 32) (n = 30) (n = 33)
HOMA-IR 1.66 ± 0.56 3.46 ± 2.70 4.46 ± 2.70 5.42 ± 3.10 P 1-2 = 0.00001
P 1-3 = 0.00001
P 2-3 = 0.13
Insulin, mcU/mL 5.57 ± 2.10 10.90 ± 5.80 11.90 ± 5.80 13.80 ± 7.40 P 1-2 = 0.0004
P 1-3 = 0.0002
P 2-3 = 0.049
CRP, ng/mL 0.48 ± 0.23 0.94 ± 0.53 1.02 ± 0.41 1.20 ± 0.73 P 1-2 = 0.0003
P 1-3 = 0.0001
P 2-3 = 0.064
Glucose, mmol/L 4.25 ± 0.12 6.58 ± 1.12 7.60 ± 3.85 8.20 ± 1.23 P 1-2 = 0.00002
P 1-3 = 0.00003
P 2-3 = 0.14
HbA1c (%) 4.60 ± 0.02 6.50 ± 0.01 7.10 ± 0.50 9.20 ± 0.60 P 1-2 = 0.0006
P 1-3 = 0.0003
P 2-3 = 0.035
GTT, mmol/L 5.12 ± 0.04 6.16 ± 0.05 11.34 ± 0.40 14.80 ± 2.10 P 1-2 = 0.0004
P 1-3 = 0.0002
P 2-3 = 0.054
SD: standard deviation; IR: insulin resistance; AH: arterial hypertension; type 2 DM: type 2 diabetes mellitus; HOMA-IR: homeostatic model
assessment for insulin resistance; CRP: C-reactive protein; HbA1c: glycated hemoglobin; GTT: glucose tolerance test
Table 2: Hemodynamic parameters in surveyed groups of patients
Control AH AH + pre-diabetes AH + type 2 DM
Indexes (n = 20) (n = 32) (n = 30) (n = 33)
SBP, mmHg 125.30 ± 4.40 158.70 ± 3.20* 173.90 ± 4.60* ,# 185.40 ± 4.80 $
DBP, mmHg 81.80 ± 5.60 90.20 ± 5.30* 98.50 ± 8.20* ,# 105.20 ± 9.30 $
LASPh, cm 2.72 ± 0.09 2.82 ± 0.90 3.25 ± 0.05* ,# 3.64 ± 0.07 $
,#
EDV, cm 3 129.00 ± 1.16 135.24 ± 1.16 141.10 ± 1.15 * 144.20 ± 1.13 #
ESV, cm 3 47.40 ± 0.30 48.10 ± 0.40 61.20 ± 0.80* ,# 78.40 ± 0.60 $
EDD, cm 3 4.62 ± 0.02 5.16 ± 0.04* 5.35 ± 0.06* ,# 5.56 ± 0.08 #
ESD LV, cm 4.12 ± 0.04 4.18 ± 0.04 3.55 ± 0.03* 3.96 ± 0.04 #
Stroke volume, cm 3 75.50 ± 1.27 83.90 ± 1.36 91.10 ± 0.74* ,# 97.20 ± 0.72 #
Ejection fraction, % 65.40 ± 0.86 66.80 ± 0.74 52.90 ± 0.42* 54.80 ± 0.44 #
Myocardium mass index LV, g/m 2 81.60 ± 0.02 98.60 ± 0.03 116.40 ± 1.42* ,# 143.40 ± 1.36 #,$
$
#
*P < 0.05 vs. control group; P < 0.05 vs. AH patients; P < 0.05 vs. patients with AH and pre-diabetes. AH: arterial hypertension; type 2
DM: type 2 diabetes mellitus; SBP: systolic blood pressure; DBP: diastolic blood pressure; LASPh: left atrial systole phase; EDV: end-
diastolic volume; ESV: end-systolic volume; EDD: end-diastolic dimension; ESD: end-systolic dimension; LV: left ventricular
0.046), and HOMA-IR (P = 0.044). Patients from group and late diastolic filling velocities.
2 in 12.3% of cases, and in 38.7% of cases from group
3 were marked as having atherosclerotic plaques with Also, the maximum ESD LV and EDD LV values
a degree of stenosis < 10%. were registered in patients of group 3 in comparison
with group 1 and control (P < 0.05) and a pattern of
LVH was diagnosed in 92.3% of patients from group 3, increase in these indicators was observed in group 2.
75.8% of patients from group 2, and 55.4% of patients The same situation was observed with respect to ESV
from group 1, compared to the controls (P < 0.05). LV and EDV LV (P < 0.05). Patients in groups 2 and 3
Patients with AH and type 2 DM were characterized by with concomitant disease had a significant increase of
an increase of average LVMM (P < 0.05) and LVMMI MMI relative to group 1 (P < 0.05).
values (P < 0.05) compared with patients in group
1, group 2, and the control group. Indices of Doppler Levels of Gal-3 were heightened in patients concomitant
echography intracardiac hemodynamics in patients AH and type 2 DM compared to groups 1 and 2, and
with AH were characterized by a decrease in the early the control group (34.2 ng/mL compared to 27.6 ng/mL,
and late diastolic filling rate of LV [Table 2]. However, 25.8 ng/mL, 15.6 ng/mL respectively, P < 0.001).
under the concomitant conditions of disease in groups
2 and 3, these indexes were significantly reduced In patients with AH and pre-diabetes we observed a
compared to group 1 and the control group (P < 0.05). trend towards a positive correlation between Gal-3,
Similar patterns were observed in the ratio of the early CRP, and HOMA-IR, which is most marked in patients
64 Vessel Plus ¦ Volume 1 ¦ June 27, 2017