
Page 104 - Read Online
P. 104
Page 8 of 11 Hawkins et al. Vessel Plus 2022;6:42 https://dx.doi.org/10.20517/2574-1209.2021.116
Table 4. Outcomes by POAF status of the matched subgroup of patients not experiencing major morbidity or mortality
POAF No POAF
Characteristics P-value
(n = 5159) (n = 5159)
STS operative mortality 0 0 N/A
STS major morbidity 0 0 N/A
Permanent stroke 0 0 N/A
Prolonged ventilation 0 0 N/A
Renal failure 0 0 N/A
Deep sternal wound infection 0 0 N/A
Reoperation, any cause 0 0 N/A
Transfusion, any 26.4 (1362) 22.4 (1153) < 0.001
Postoperative LOS (days) 7.0 (5.0-9.0) 5.0 (4.0-7.0) < 0.001
ICU LOS (h) 50.5 (27.5-94.4) 47.1 (26.4-72.8) < 0.001
Discharge to facility 24.2 (1249) 21.2 (1092) < 0.001
Readmission 10.8 (539) 7.49 (372) < 0.001
Total hospital cost 39,598 (31,960-50,362) 36,142 (29,773-44,526) < 0.001
Total stay cost 11,384 (8073-16,130) 9429 (6720-13,273) < 0.001
Diagnostic cost 2968 (2019-4487) 2677 (1869-3962) < 0.001
Intervention cost 17,352 (13,978-23,244) 16,942 (13,720-22,207) < 0.001
General care cost 5633 (3855-8013) 4893 (3298-6932) < 0.001
Other care cost 0 (0-232) 0 (0-204) 0.857
ICU: Intensive care unit; LOS: length of stay; POAF: postoperative atrial fibrillation; PRBC: packed red blood cells; STS: Society of Thoracic
Surgeons.
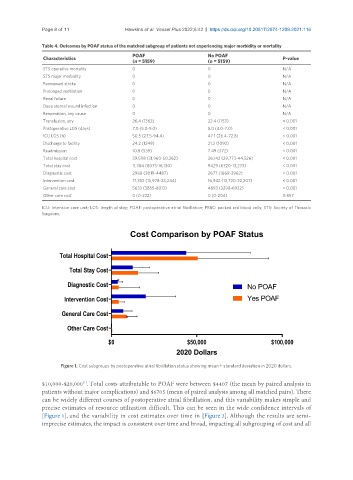
Figure 1. Cost subgroups by postoperative atrial fibrillation status showing mean ± standard deviation in 2020 dollars.
$10,000-$20,000 . Total costs attributable to POAF were between $4407 (the mean by paired analysis in
[1]
patients without major complications) and $6705 (mean of paired analysis among all matched pairs). There
can be widely different courses of postoperative atrial fibrillation, and this variability makes simple and
precise estimates of resource utilization difficult. This can be seen in the wide confidence intervals of
[Figure 1], and the variability in cost estimates over time in [Figure 2]. Although the results are semi-
imprecise estimates, the impact is consistent over time and broad, impacting all subgrouping of cost and all