
Page 102 - Read Online
P. 102
Page 6 of 11 Hawkins et al. Vessel Plus 2022;6:42 https://dx.doi.org/10.20517/2574-1209.2021.116
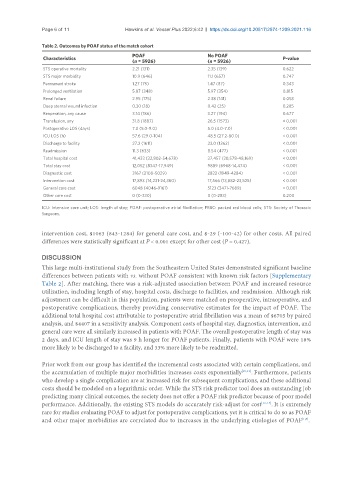
Table 2. Outcomes by POAF status of the match cohort
POAF No POAF
Characteristics P-value
(n = 5926) (n = 5926)
STS operative mortality 2.21 (131) 2.35 (139) 0.622
STS major morbidity 10.9 (646) 11.1 (657) 0.747
Permanent stroke 1.27 (75) 1.47 (87) 0.343
Prolonged ventilation 5.87 (348) 5.97 (354) 0.815
Renal failure 2.95 (175) 2.38 (141) 0.053
Deep sternal wound infection 0.30 (18) 0.42 (25) 0.285
Reoperation, any cause 3.14 (186) 3.27 (194) 0.677
Transfusion, any 31.8 (1887) 26.5 (1573) < 0.001
Postoperative LOS (days) 7.0 (5.0-9.0) 5.0 (4.0-7.0) < 0.001
ICU LOS (h) 57.6 (29.0-104) 48.5 (27.2-80.0) < 0.001
Discharge to facility 27.2 (1611) 23.0 (1362) < 0.001
Readmission 11.3 (633) 8.54 (477) < 0.001
Total hospital cost 41,433 (32,802-54,678) 37,457 (30,578-48,169) < 0.001
Total stay cost 12,052 (8347-17,949) 9889 (6968-14,474) < 0.001
Diagnostic cost 3167 (2100-5029) 2822 (1949-4284) < 0.001
Intervention cost 17,893 (14,231-24,360) 17,566 (13,882-23,525) < 0.001
General care cost 6048 (4046-9161) 5123 (3471-7689) < 0.001
Other care cost 0 (0-330) 0 (0-283) 0.200
ICU: Intensive care unit; LOS: length of stay; POAF: postoperative atrial fibrillation; PRBC: packed red blood cells; STS: Society of Thoracic
Surgeons.
intervention cost, $1063 (843-1284) for general care cost, and $-29 (-100-42) for other costs. All paired
differences were statistically significant at P < 0.001 except for other cost (P = 0.427).
DISCUSSION
This large multi-institutional study from the Southeastern United States demonstrated significant baseline
differences between patients with vs. without POAF consistent with known risk factors [Supplementary
Table 2]. After matching, there was a risk-adjusted association between POAF and increased resource
utilization, including length of stay, hospital costs, discharge to facilities, and readmission. Although risk
adjustment can be difficult in this population, patients were matched on preoperative, intraoperative, and
postoperative complications, thereby providing conservative estimates for the impact of POAF. The
additional total hospital cost attributable to postoperative atrial fibrillation was a mean of $6705 by paired
analysis, and $4407 in a sensitivity analysis. Component costs of hospital stay, diagnostics, intervention, and
general care were all similarly increased in patients with POAF. The overall postoperative length of stay was
2 days, and ICU length of stay was 9 h longer for POAF patients. Finally, patients with POAF were 18%
more likely to be discharged to a facility, and 33% more likely to be readmitted.
Prior work from our group has identified the incremental costs associated with certain complications, and
the accumulation of multiple major morbidities increases costs exponentially [10,11] . Furthermore, patients
who develop a single complication are at increased risk for subsequent complications, and these additional
costs should be modeled on a logarithmic order. While the STS risk predictor tool does an outstanding job
predicting many clinical outcomes, the society does not offer a POAF risk predictor because of poor model
performance. Additionally, the existing STS models do accurately risk-adjust for cost [12-14] . It is extremely
rare for studies evaluating POAF to adjust for postoperative complications, yet it is critical to do so as POAF
[1,6]
and other major morbidities are correlated due to increases in the underlying etiologies of POAF .