


Page 58 - Read Online
P. 58
Page 6 of 10                 Dall’Ara et al. Vessel Plus 2023;7:26  https://dx.doi.org/10.20517/2574-1209.2023.107

               Table 3. Procedural and long-term outcome
                                     Overall   Fem                                              1    2
                Variable                                Rad_Stand 114 (51.1)  Rad_SGC 37 (16.6)  P   P
                                     n = 223   72 (32.3)
                Procedural success   199 (89.2)  60 (83.3)  105 (92.1)      34 (91.9)          0.145  0.601
                Procedural complication
                - MI                 7 (3.1)   3 (4.2)   3 (2.6)            1 (2.7)            0.831   1.000
                - stroke             0 (0.0)   0 (0.0)   0 (0.0)            0 (0.0)            n.a.   n.a.
                - no-reflow          3 (1.3)   2 (2.8)   1 (0.9)            0 (0.0)            0.405   1.000
                - coronary perforation    0 (0.0)   0 (0.0)   0 (0.0)       0 (0.0)            n.a.   n.a.
                - burr entrapment    0 (0.0)   0 (0.0)   0 (0.0)            0 (0.0)            n.a.   n.a.
                - unsealed dissection  4 (1.8)  2 (2.8)  2 (1.8)            0 (0.0)            0.585  1.000
                Bleeding ARC > 2     5 (2.2)   4 (5.6)  1 (0.9)             0 (0.0)            0.066  1.000
                Any vascular complication  9 (4.0)  6 (8.3)  3 (2.6)        0 (0.0)            0.062  1.000
                Procedural death     2 (0.9)   1 (1.4)  0 (0.0)             1 (2.7)            0.275  0.245
                TLR at follow-up     8 (3.6)   5 (6.9)  3 (2.7)             0 (0.0)            0.136  1.000

               Categorical variables are shown as number (percentage); continuous variables as median (interquartile range) or mean value (±standard
               deviation). Fem: Femoral access; MI: myocardial infarction; n.a.: not applicable; Rad_SGC: radial sheathless guiding catheter access; Rad_Stand:
                                                      1                           2
               radial standard access; TLR: target lesion revascularization; P : comparison between the three groups; P : comparison between the two radial
               groups.


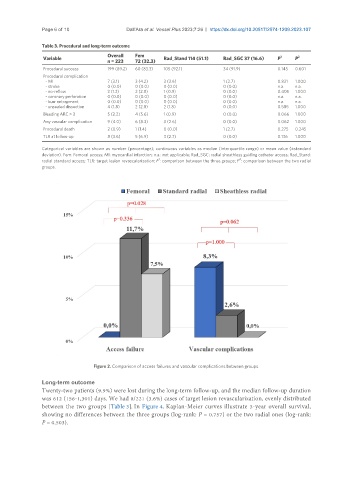
                                 Figure 2. Comparison of access failures and vascular complications between groups.

               Long-term outcome
               Twenty-two patients (9.9%) were lost during the long-term follow-up, and the median follow-up duration
               was 612 (156-1,301) days. We had 8/221 (3.6%) cases of target lesion revascularization, evenly distributed
               between the two groups [Table 3]. In Figure 4, Kaplan-Meier curves illustrate 3-year overall survival,
               showing no differences between the three groups (log-rank: P = 0.757) or the two radial ones (log-rank:
               P = 0.503).

