
Page 243 - Read Online
P. 243
Page 8 of 14 Sufali et al. Vessel Plus 2024;8:16 https://dx.doi.org/10.20517/2574-1209.2023.139
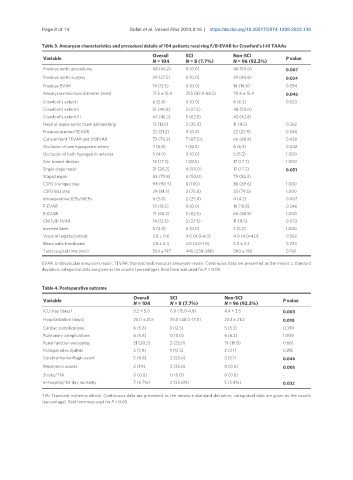
Table 3. Aneurysm characteristics and procedural details of 104 patients receiving F/B-EVAR for Crawford’s I-III TAAAs
Overall SCI Non-SCI
Variable P value
N = 104 N = 8 (7.7%) N = 96 (92.3%)
Previous aortic procedures 48 (46.2) 0 (0.0) 48 (50.0) 0.007
Previous aortic surgery 39 (37.5) 0 (0.0) 39 (40.6) 0.024
Previous EVAR 14 (13.5) 0 (0.0) 14 (14.6) 0.594
Aneurysm maximum diameter (mm) 71.5 ± 15.4 71.5 (83.8-68.5) 70.6 ± 15.4 0.045
Crawford’s extent I 6 (5.8) 0 (0.0) 6 (6.3) 0.520
Crawford’s extent II 51 (49.0) 3 (37.5) 48 (50.0)
Crawford’s extent III 47 (45.2) 5 (62.5) 42 (43.8)
Need of supra-aortic trunk debranching 13 (12.5) 2 (25.0) 11 (11.5) 0.262
Previous planned TEVAR 22 (21.2) 0 (0.0) 22 (22.9) 0.346
Concomitant TEVAR and f/bEVAR 73 (70.2) 7 (87.5)) 66 (68.8) 0.438
Occlusion of one hypogastric artery 7 (6.8) 1 (12.5) 6 (6.3) 0.442
Occlusion of both hypogastric arteries 5 (4.9) 0 (0.0) 5 (5.3) 1.000
Iliac branch devices 18 (17.3) 1 (12.5) 17 (17.7) 1.000
Single stage repair 21 (20.2) 4 (50.0) 17 (17.7) 0.051
Staged repair 83 (79.8) 4 (50.0) 79 (82.3)
CSFD I/unique step 94 (90.4) 8 (100) 86 (89.6) 1.000
CSFD last step 39 (81.3) 3 (75.0) 35 (79.5) 1.000
Intraoperative SEPs/MEPs 6 (5.8) 2 (25.0) 4 (4.2) 0.067
F-EVAR 19 (18.3) 0 (0.0) 19 (19.8) 0.346
B-EVAR 71 (68.3) 5 (62.5) 66 (68.8) 1.000
CM F/B-EVAR 14 (13.5) 3 (37.5) 11 (11.5) 0.073
Inverted Limb 5 (4.8) 0 (0.0) 5 (5.2) 1.000
Visceral targets/patient 3.8 ± 0.6 4.0 (4.0-4,0) 4.0 (4.0-4.0) 0.562
Blood units transfusion 2.8 ± 2.4 3.0 (4.0-1.0) 3.0 ± 2.3 0.743
Total surgical time (min) 554 ± 197 445 (338-386) 560 ± 198 0.192
EVAR: Endovascular aneurysm repair; TEVAR: thoracic endovascular aneurysm repair. Continuous data are presented as the means ± standard
deviation; categorical data are given as the counts (percentage). Bold form was used for P < 0.05.
Table 4. Postoperative outcome
Overall SCI Non-SCI
Variable N = 104 N = 8 (7.7%) N = 96 (92.3%) P value
ICU stay (days) 5.2 ± 5.0 6.0 (15.0-4.8) 4.4 ± 3.5 0.003
Hospitalization (days) 25.0 ± 21.5 35.0 (48.0-17.0) 23.2 ± 21.0 0.010
Cardiac complications 6 (5.8) 1 (12.5) 5 (5.2) 0.389
Pulmonary complications 6 (5.8) 0 (0.0) 6 (6.3) 1.000
Renal function worsening 21 (20.2) 2 (25.0) 19 (19.8) 0.661
Postoperative dyalisis 3 (2.9) 1 (12.5) 2 (2.1) 0.215
Cerebral hemorrhagic event 5 (4.8) 2 (25.0) 3 (3.1) 0.046
Mesenteric events 2 (1.9) 2 (25.0) 0 (0.0) 0.005
Stroke/TIA 0 (0.0) 0 (0.0) 0 (0.0) -
In-hospital/30-day mortality 7 (6.7%) 2 (25.0%) 5 (5.8%) 0.032
TIA: Transient ischemic attack. Continuous data are presented as the means ± standard deviation; categorical data are given as the counts
(percentage). Bold form was used for P < 0.05.