
Page 406 - Read Online
P. 406
Guagnano et al. Plast Aesthet Res 2020;7:37 I http://dx.doi.org/10.20517/2347-9264.2020.21 Page 5 of 10
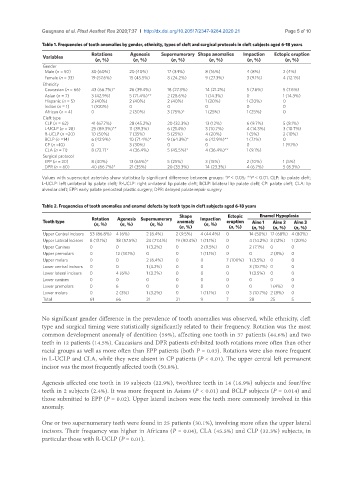
Table 1. Frequencies of tooth anomalies by gender, ethnicity, types of cleft and surgical protocols in cleft subjects aged 6-18 years
Rotations Agenesis Supernumerary Shape anomalies Impaction Ectopic eruption
Variables
(n, %) (n, %) (n, %) (n, %) (n, %) (n, %)
Gender
Male (n = 50) 30 (60%) 20 (40%) 17 (34%) 8 (16%) 4 (8%) 2 (4%)
Female (n = 33) 19 (57.6%) 15 (45.5%) 8 (24.2%) 9 (27.3%) 3 (9.1%) 4 (12.1%)
Ethnicity
Caucasian (n = 66) 43 (66.7%)* 26 (39.4%) 18 (27.3%) 14 (21.2%) 5 (7.6%) 5 (7.6%)
Asian (n = 7) 3 (42.9%) 5 (71.4%)** 2 (28.6%) 1 (14.3%) 0 1 (14.3%)
Hispanic (n = 5) 2 (40%) 2 (40%) 2 (40%) 1 (20%) 1 (20%) 0
Indian (n = 1) 1 (100%) 0 0 0 0 0
African (n = 4) 0 2 (50%) 3 (75%)* 1 (25%) 1 (25%) 0
Cleft type
CLP (n = 62) 41 (67.7%) 28 (45.2%) 20 (32.3%) 13 (12%) 6 (9.7%) 5 (8.1%)
L-UCLP (n = 28) 25 (89.3%)** 11 (39.3%) 6 (21.4%) 3 (10.7%) 4 (14.3%) 3 (10.7%)
R-UCLP (n =20) 10 (50%) 7 (35%) 5 (25%) 4 (20%) 1 (5%) 2 (10%)
BCLP (n =14) 6 (42.9%) 10 (71.4%)* 9 (64.3%)* 6 (42.9%)** 1 (7.1%) 0
CP (n =10) 0 3 (30%) 0 0 0 1 (9.1%)
CLA (n = 11) 8 (72.7)* 4 (36.4%) 5 (45.5%)* 4 (36.4%)** 1 (9.1%)
Surgical protocol
EPP (n = 20) 8 (40%) 13 (65%)* 5 (25%) 3 (15%) 2 (10%) 1 (5%)
DPR (n = 60) 40 (66.7%)* 21 (35%) 20 (33.3%) 14 (23.3%) 4 (6.7%) 5 (8.3%)
Values with superscript asterisks show statistically significant difference between groups: *P < 0.05; **P < 0.01. CLP: lip palate cleft;
L-UCLP: left unilateral lip palate cleft; R-UCLP: right unilateral lip palate cleft; BCLP: bilateral lip palate cleft; CP: palate cleft; CLA: lip
alveolar cleft; EPP: early palate periosteal plastic surgery; DPR: delayed palate repair surgery
Table 2. Frequencies of tooth anomalies and enamel defects by tooth type in cleft subjects aged 6-18 years
Rotation Agenesis Supernumerary Shape Impaction Ectopic Enamel Hypoplasia
Tooth type (n, %) (n, %) (n, %) anomaly (n, %) eruption Aine 1 Aine 2 Aine 3
(n, %) (n, %) (n, %) (n, %) (n, %)
Upper Central incisors 53 (86.8%) 4 (6%) 2 (6.4%) 2 (9.5%) 4 (44.4%) 0 14 (50%) 17 (68%) 4 (80%)
Upper Lateral Incisors 8 (13.1%) 38 (57.5%) 24 (77.4%) 19 (90.4%) 1 (11.1%) 0 4 (14.2%) 3 (12%) 1 (20%)
Upper Canines 0 0 1 (3.2%) 0 2 (9.5%) 0 2 (7.1%) 0 0
Upper premolars 0 12 (18.1%) 0 0 1 (11.1%) 0 0 2 (8%) 0
Upper molars 0 0 2 (6.4%) 0 0 7 (100%) 1 (3.5%) 0 0
Lower central incisors 0 0 1 (3.2%) 0 0 0 3 (10.7%) 0 0
Lower lateral incisors 0 4 (6%) 1 (3.2%) 0 0 0 1 (3.5%) 0 0
Lower canines 0 0 0 0 0 0 0 0 0
Lower premolars 0 6 0 0 0 0 0 1 (4%) 0
Lower molars 0 2 (3%) 1 (3.2%) 0 1 (11.1%) 0 3 (10.7%) 2 (8%) 0
Total 61 66 31 21 9 7 28 25 5
No significant gender difference in the prevalence of tooth anomalies was observed, while ethnicity, cleft
type and surgical timing were statistically significantly related to their frequency. Rotation was the most
common development anomaly of dentition (59%), affecting one tooth in 37 patients (44.6%) and two
teeth in 12 patients (14.5%). Caucasians and DPR patients exhibited tooth rotations more often than other
racial groups as well as more often than EPP patients (both P = 0.03). Rotations were also more frequent
in L-UCLP and CLA, while they were absent in CP patients (P < 0.01). The upper central left permanent
incisor was the most frequently affected tooth (50.8%).
Agenesis affected one tooth in 19 subjects (22.9%), two/three teeth in 14 (16.9%) subjects and four/five
teeth in 2 subjects (2.4%). It was more frequent in Asians (P < 0.01) and BCLP subjects (P = 0.014) and
those submitted to EPP (P = 0.02). Upper lateral incisors were the teeth more commonly involved in this
anomaly.
One or two supernumerary teeth were found in 25 patients (30.1%), involving more often the upper lateral
incisors. Their frequency was higher in Africans (P = 0.04), CLA (45.5%) and CLP (32.3%) subjects, in
particular those with R-UCLP (P = 0.01).