
Page 20 - Read Online
P. 20
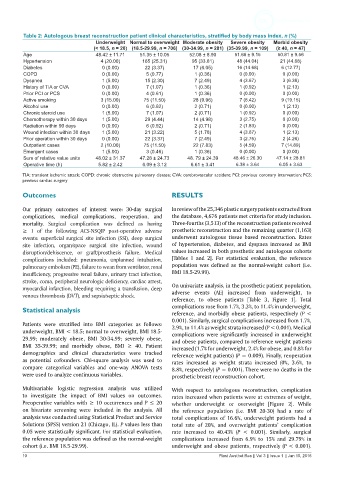
Table 2: Autologous breast reconstruction patient clinical characteristics, stratified by body mass index, n (%)
                                   Underweight  Normal to overweight Moderate obesity  Severe obesity  Morbid obesity
                                  (< 18.5, n = 20) (18.5-29.99, n = 706) (30-34.99, n = 281) (35-39.99, n = 109)  (≥ 40, n = 47)
         Age                       48.42 ± 11.71  51.35 ± 10.05     52.08 ± 8.90   51.66 ± 9.15    50.81 ± 9.56
         Hypertension               4 (20.00)      165 (25.31)      95 (33.81)      48 (44.04)     21 (44.68)
         Diabetes                    0 (0.00)       22 (3.37)        17 (6.05)      16 (14.68)      6 (12.77)
         COPD                        0 (0.00)       5 (0.77)         1 (0.36)        0 (0.00)       0 (0.00)
         Dyspnea                     1 (5.00)       15 (2.30)        7 (2.49)        4 (3.67)       3 (6.38)
         History of TIA or CVA       0 (0.00)       7 (1.07)         1 (0.36)        1 (0.92)       1 (2.13)
         Prior PCI or PCS            0 (0.00)       4 (0.61)         1 (0.36)        0 (0.00)       0 (0.00)
         Active smoking             3 (15.00)       75 (11.50)       28 (9.96)       7 (6.42)       9 (19.15)
         Alcohol use                 0 (0.00)       6 (0.92)         2 (0.71)        0 (0.00)       1 (2.13)
         Chronic steroid use         1 (5.00)       7 (1.07)         2 (0.71)        1 (0.92)       0 (0.00)
         Chemotherapy within 30 days  1 (5.00)      29 (4.44)        14 (4.98)       3 (2.75)       0 (0.00)
         Radiation within 90 days    0 (0.00)       6 (0.92)         2 (0.71)        2 (1.83)       0 (0.00)
         Wound infection within 30 days  1 (5.00)   21 (3.22)        5 (1.78)        4 (3.67)       1 (2.13)
         Prior operation within 30 days  0 (0.00)   22 (3.37)        7 (2.49)        3 (2.75)       2 (4.26)
         Outpatient cases           2 (10.00)       75 (11.50)       22 (7.83)       5 (4.59)       7 (14.89)
         Emergent cases              1 (5.00)       3 (0.46)         1 (0.36)        0 (0.00)       0 (0.00)
         Sum of relative value units  48.02 ± 31.37  47.28 ± 24.73  48. 79 ± 24.39  48.46 ± 26.30  47.14 ± 28.81
         Operative time (h)         5.82 ± 2.42    6.09 ± 3.12      6.61 ± 3.41     6.38 ± 3.64    6.05 ± 3.63

         TIA: transient ischemic attack; COPD: chronic obstructive pulmonary disease; CVA: cerebrovascular accident; PCI: previous coronary intervention; PCS:
         previous cardiac surgery

         Outcomes                                            RESULTS

         Our  primary outcomes of  interest  were: 30-day  surgical   In review of the 25,346 plastic surgery patients extracted from
         complications,  medical  complications,  reoperation,  and   the database, 4,676 patients met criteria for study inclusion.
         mortality.  Surgical complication was defined as having   Three-fourths (3,513) of the reconstruction patients received
         ≥  1  of  the  following  ACS-NSQIP  post-operative  adverse   prosthetic reconstruction and the remaining quarter (1,163)
         events: superficial surgical site infection (SSI), deep surgical   underwent autologous tissue  based reconstruction. Rates
         site  infection,  organ/space  surgical  site  infection,  wound   of hypertension, diabetes,  and dyspnea increased as BMI
         disruption/dehiscence,  or  graft/prosthesis failure.  Medical   values increased in both prosthetic and autologous cohorts
         complications included: pneumonia, unplanned intubation,   [Tables 1 and 2]. For statistical evaluation, the reference
         pulmonary embolism (PE), failure to wean from ventilator, renal   population  was defined as the normal-weight cohort  (i.e.
         insufficiency, progressive renal failure, urinary tract infection,   BMI 18.5-29.99).
         stroke, coma, peripheral neurologic deficiency, cardiac arrest,
         myocardial infarction, bleeding requiring a transfusion, deep   On univariate analysis, in the prosthetic patient population,
         venous thrombosis (DVT), and sepsis/septic shock.   adverse events  (AE) increased from underweight,  to
                                                             reference, to obese patients [Table 3, Figure 1]. Total
                                                             complications rose from 1.7%, 3.3%, to 11.4% in underweight,
         Statistical analysis
                                                             reference, and morbidly obese patients, respectively (P <
                                                             0.001). Similarly, surgical complications increased from 1.7%,
         Patients were stratified into BMI categories as follows:   2.9%, to 11.4% as weight strata increased (P < 0.001). Medical
         underweight, BMI < 18.5; normal to overweight, BMI 18.5-  complications were significantly increased in underweight
         29.99; moderately  obese,  BMI  30-34.99; severely  obese,   and obese patients, compared to reference weight patients
         BMI  35-39.99;  and  morbidly  obese,  BMI  ≥  40.  Patient   increased (1.7% for underweight, 2.4% for obese, and 0.8% for
         demographics and clinical characteristics were tracked   reference weight patients) (P = 0.009). Finally, reoperation
         as potential cofounders.  Chi-square analysis was used to   rates  increased as  weight  strata  increased (0%, 3.6%, to
         compare categorical variables and one-way ANOVA tests   8.8%, respectively) (P = 0.001). There were no deaths in the
         were used to analyze continuous variables.          prosthetic breast reconstruction cohort.

         Multivariable logistic  regression analysis was utilized   With respect to autologous  reconstruction, complication
         to  investigate  the  impact  of BMI  values  on outcomes.   rates increased when patients were at extremes of weight,
         Preoperative variables with ≥ 10 occurrences and P ≤ 20   whether underweight  or overweight  [Figure 2]. While
         on  bivariate  screening  were  included in  the  analysis.  All   the  reference population (i.e.  BMI 20-30)  had a rate of
         analysis was conducted using Statistical Product and Service   total complications of 16.6%,  underweight patients had a
         Solutions (SPSS) version 21 (Chicago, IL). P values less than   total rate of 20%, and overweight  patients’  complication
         0.05 were statistically significant. For statistical evaluation,   rate  increased to  40.43% (P  <  0.001). Similarly,  surgical
         the reference population was defined as the normal-weight   complications  increased from 6.9%  to 15%  and 29.79%  in
         cohort (i.e. BMI 18.5-29.99).                       underweight and obese patients, respectively (P < 0.001).
         10                                                                   Plast Aesthet Res || Vol 3 || Issue 1 || Jan 15, 2016