
Page 55 - Read Online
P. 55
Page 6 of 10 Hart et al. Plast Aesthet Res. 2026;13:3
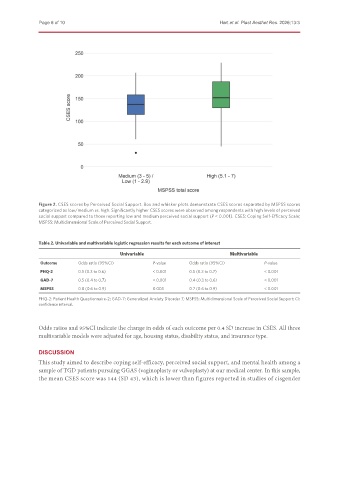
Figure 2. CSES scores by Perceived Social Support. Box and whisker plots demonstrate CSES scores separated by MSPSS scores
categorized as low/medium vs. high. Significantly higher CSES scores were observed among respondents with high levels of perceived
social support compared to those reporting low and medium perceived social support (P < 0.001). CSES: Coping Self-Efficacy Scale;
MSPSS: Multidimensional Scale of Perceived Social Support.
Table 2. Univariable and multivariable logistic regression results for each outcome of interest
Univariable Multivariable
Outcome Odds ratio (95%CI) P-value Odds ratio (95%CI) P-value
PHQ-2 0.5 (0.3 to 0.6) < 0.001 0.5 (0.3 to 0.7) < 0.001
GAD-7 0.5 (0.4 to 0.7) < 0.001 0.4 (0.3 to 0.6) < 0.001
MSPSS 0.8 (0.6 to 0.9) 0.003 0.7 (0.6 to 0.9) < 0.001
PHQ-2: Patient Health Questionnaire-2; GAD-7: Generalized Anxiety Disorder 7; MSPSS: Multidimensional Scale of Perceived Social Support; CI:
confidence interval.
Odds ratios and 95%CI indicate the change in odds of each outcome per 0.4 SD increase in CSES. All three
multivariable models were adjusted for age, housing status, disability status, and insurance type.
DISCUSSION
This study aimed to describe coping self-efficacy, perceived social support, and mental health among a
sample of TGD patients pursuing GGAS (vaginoplasty or vulvoplasty) at our medical center. In this sample,
the mean CSES score was 144 (SD 43), which is lower than figures reported in studies of cisgender