Page 53 - Read Online
P. 53

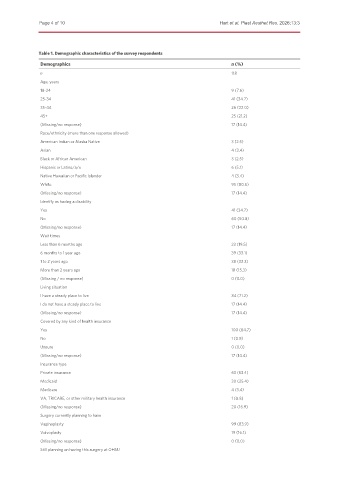
Page 4 of 10                                                   Hart et al. Plast Aesthet Res. 2026;13:3


               Table 1. Demographic characteristics of the survey respondents
               Demographics                                                       n (%)

               n                                                                  118
               Age, years
               18-24                                                              9 (7.6)
               25-34                                                              41 (34.7)
               35-44                                                              26 (22.0)
               45+                                                                25 (21.2)
               (Missing/no response)                                              17 (14.4)
               Race/ethnicity (more than one response allowed)
               American Indian or Alaska Native                                   3 (2.5)
               Asian                                                              4 (3.4)
               Black or African American                                          3 (2.5)
               Hispanic or Latino/a/x                                             6 (5.1)
               Native Hawaiian or Pacific Islander                                4 (3.4)
               White                                                              95 (80.5)
               (Missing/no response)                                              17 (14.4)
               Identify as having a disability
               Yes                                                                41 (34.7)
               No                                                                 60 (50.8)
               (Missing/no response)                                              17 (14.4)
               Wait times
               Less than 6 months ago                                             23 (19.5)
               6 months to 1 year ago                                             39 (33.1)
               1 to 2 years ago                                                   38 (32.2)
               More than 2 years ago                                              18 (15.3)
               (Missing / no response)                                            0 (0.0)
               Living situation
               I have a steady place to live                                      84 (71.2)
               I do not have a steady place to live                               17 (14.4)
               (Missing/no response)                                              17 (14.4)
               Covered by any kind of health insurance
               Yes                                                                100 (84.7)
               No                                                                 1 (0.8)
               Unsure                                                             0 (0.0)
               (Missing/no response)                                              17 (14.4)
               Insurance type
               Private insurance                                                  63 (53.4)
               Medicaid                                                           30 (25.4)
               Medicare                                                           4 (3.4)
               VA, TRICARE, or other military health insurance                    1 (0.8)
               (Missing/no response)                                              20 (16.9)
               Surgery currently planning to have
               Vaginoplasty                                                       99 (83.9)
               Vulvoplasty                                                        19 (16.1)
               (Missing/no response)                                              0 (0.0)
               Still planning on having this surgery at OHSU
   48   49   50   51   52   53   54   55   56   57   58