
Page 10 - Read Online
P. 10
Page 4 of 15 Gunderson et al. Plast Aesthet Res 2023;10:50 https://dx.doi.org/10.20517/2347-9264.2023.42
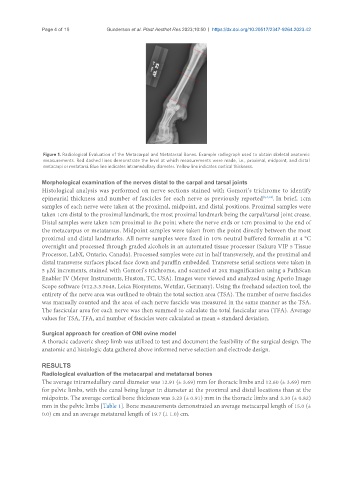
Figure 1. Radiological Evaluation of the Metacarpal and Metatarsal Bones. Example radiograph used to obtain skeletal anatomic
measurements. Red dashed lines demonstrate the level at which measurements were made, i.e., proximal, midpoint, and distal
metacarpi or metatarsi. Blue line indicates intramedullary diameter. Yellow line indicates cortical thickness.
Morphological examination of the nerves distal to the carpal and tarsal joints
Histological analysis was performed on nerve sections stained with Gomori’s trichrome to identify
epineurial thickness and number of fascicles for each nerve as previously reported [3,4,13] . In brief, 1cm
samples of each nerve were taken at the proximal, midpoint, and distal positions. Proximal samples were
taken 1cm distal to the proximal landmark, the most proximal landmark being the carpal/tarsal joint crease.
Distal samples were taken 1cm proximal to the point where the nerve ends or 1cm proximal to the end of
the metacarpus or metatarsus. Midpoint samples were taken from the point directly between the most
proximal and distal landmarks. All nerve samples were fixed in 10% neutral buffered formalin at 4 °C
overnight and processed through graded alcohols in an automated tissue processor (Sakura VIP 5 Tissue
Processor, LabX, Ontario, Canada). Processed samples were cut in half transversely, and the proximal and
distal transverse surfaces placed face down and paraffin embedded. Transverse serial sections were taken in
5 µM increments, stained with Gomori’s trichrome, and scanned at 20x magnification using a PathScan
Enabler IV (Meyer Instruments, Huston, TC, USA). Images were viewed and analyzed using Aperio Image
Scope software (v12.3.3.5048, Leica Biosystems, Wetzlar, Germany). Using the freehand selection tool, the
entirety of the nerve area was outlined to obtain the total section area (TSA). The number of nerve fascicles
was manually counted and the area of each nerve fascicle was measured in the same manner as the TSA.
The fascicular area for each nerve was then summed to calculate the total fascicular area (TFA). Average
values for TSA, TFA, and number of fascicles were calculated as mean ± standard deviation.
Surgical approach for creation of ONI ovine model
A thoracic cadaveric sheep limb was utilized to test and document the feasibility of the surgical design. The
anatomic and histologic data gathered above informed nerve selection and electrode design.
RESULTS
Radiological evaluation of the metacarpal and metatarsal bones
The average intramedullary canal diameter was 12.91 (± 3.69) mm for thoracic limbs and 12.60 (± 3.69) mm
for pelvic limbs, with the canal being larger in diameter at the proximal and distal locations than at the
midpoints. The average cortical bone thickness was 3.23 (± 0.91) mm in the thoracic limbs and 3.30 (± 0.82)
mm in the pelvic limbs [Table 1]. Bone measurements demonstrated an average metacarpal length of 15.0 (±
0.0) cm and an average metatarsal length of 19.7 (± 1.0) cm.