
Page 76 - Read Online
P. 76
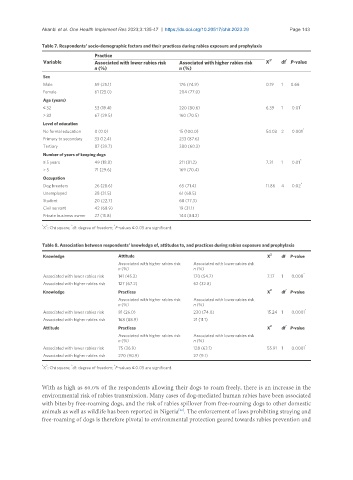
Akanbi et al. One Health Implement Res 2023;3:135-47  https://dx.doi.org/10.20517/ohir.2023.29                               Page 143

               Table 7. Respondents’ socio-demographic factors and their practices during rabies exposure and prophylaxis
                                 Practice
                                                                                                 *
                Variable         Associated with lower rabies risk   Associated with higher rabies risk   X 2*  df P-value
                                 n (%)                       n (%)
                Sex
                Male             59 (25.1)                   176 (74.9)                    0.19  1  0.66
                Female           61 (23.0)                   204 (77.0)
                Age (years)
                                                                                                      *
                ≤ 32             53 (19.4)                   220 (80.6)                    6.39  1  0.01
                > 32             67 (29.5)                   160 (70.5)
                Level of education
                No formal education  0 (0.0)                 15 (100.0)                    54.03 2  0.001  *
                Primary to secondary  33 (12.4)              233 (87.6)
                Tertiary         87 (39.7)                   380 (60.3)
                Number of years of keeping dogs
                ≤ 5 years        49 (18.8)                   211 (81.2)                    7.31  1  0.01 *
                > 5              71 (29.6)                   169 (70.4)
                Occupation
                                                                                                      *
                Dog breeders     26 (28.6)                   65 (71.4)                     11.86  4  0.02
                Unemployed       28 (31.5)                   61 (68.5)
                Student          20 (22.7)                   68 (77.3)
                Civil servant    42 (68.9)                   19 (31.1)
                Private business owner  27 (15.8)            144 (84.2)
               * 2       *              *
                X : Chi square;  df: degree of freedom;  P-values ≤ 0.05 are significant.

               Table 8. Association between respondents’ knowledge of, attitudes to, and practices during rabies exposure and prophylaxis
                Knowledge                Attitude                                          X 2  df  P-value
                                         Associated with higher rabies risk   Associated with lower rabies risk
                                         n (%)                    n (%)
                                                                                                       *
                Associated with lower rabies risk  141 (45.3)     170 (54.7)               7.17  1  0.008
                Associated with higher rabies risk  127 (67.2)    62 (32.8)
                Knowledge                Practices                                         X 2  df *  P-value
                                         Associated with higher rabies risk   Associated with lower rabies risk
                                         n (%)                    n (%)
                Associated with lower rabies risk  81 (26.0)      230 (74.0)               15.24 1  0.0001 *
                Associated with higher rabies risk  168 (88.9)    21 (11.1)
                Attitude                 Practices                                         X 2  df *  P-value
                                         Associated with higher rabies risk   Associated with lower rabies risk
                                         n (%)                    n (%)
                                                                                                        *
                Associated with lower rabies risk  75 (36.9)      128 (63.1)               55.91  1  0.0001
                Associated with higher rabies risk  270 (90.9)    27 (9.1)
               * 2       *              *
                X : Chi square;  df: degree of freedom;  P-values ≤ 0.05 are significant.

               With as high as 60.0% of the respondents allowing their dogs to roam freely, there is an increase in the
               environmental risk of rabies transmission. Many cases of dog-mediated human rabies have been associated
               with bites by free-roaming dogs, and the risk of rabies spillover from free-roaming dogs to other domestic
               animals as well as wildlife has been reported in Nigeria . The enforcement of laws prohibiting straying and
                                                             [26]
               free-roaming of dogs is therefore pivotal to environmental protection geared towards rabies prevention and