
Page 78 - Read Online
P. 78
Page 256 Benusa et al. Neuroimmunol Neuroinflammation 2020;7:248-63 I http://dx.doi.org/10.20517/2347-8659.2020.03
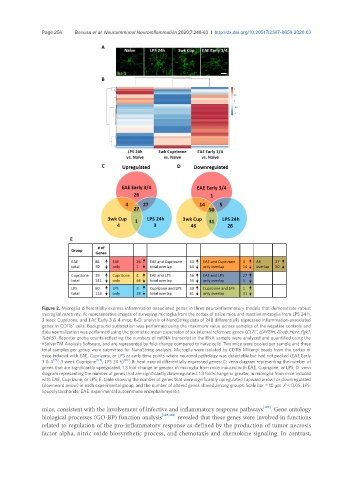
Figure 2. Microglia differentially express inflammation-associated genes in three neuroinflammatory models that demonstrate robust
microglial reactivity. A: representative images of surveying microglia from the cortex of naïve mice and reactive microglia from LPS 24 h,
3 week Cuprizone, and EAE Early 3 & 4 mice; B-D: analysis of NanoString data of 248 differentially expressed inflammation-associated
+
genes in CD11b cells. Background subtraction was performed using the maximum value across samples of the negative controls and
data normalization was performed using the geometric mean expression of six internal reference genes (CLTC, GAPDH, Gusb, Hprt, Pgk1,
Tubb5). Reporter probe counts reflecting the numbers of mRNA transcript in the RNA sample were analyzed and quantified using the
nSolverTM Analysis Software, and are represented by fold-change compared to naïve cells. Two mice were pooled per sample and three
total samples per group were submitted for NanoString analysis. Microglia were isolated by CD11b Miltenyi beads from the cortex of
mice induced with EAE, Cuprizone, or LPS at early time points where neuronal pathology was detectable but had not peaked (EAE Early
3 & 4 [79] , 3 week Cuprizone [123] , LPS 24 h) [80] ; B: heat map of differentially expressed genes; C: venn diagram representing the number of
genes that are significantly upregulated, 1.3 fold-change or greater, in microglia from mice induced with EAE, Cuprizone, or LPS; D: venn
diagram representing the number of genes that are significantly downregulated, 1.3 fold-change or greater, in microglia from mice induced
with EAE, Cuprizone, or LPS; E: table showing the number of genes that were significantly upregulated (upward arrow) or downregulated
(downward arrow) in each experimental group, and the number of altered genes shared among groups. Scale bar = 10 μm. P < 0.05. LPS:
lipopolysaccharide; EAE: experimental autoimmune encephalomyelitis
mice, consistent with the involvement of infective and inflammatory response pathways [127] . Gene ontology
biological processes (GO-BP) function analysis [125,126] revealed that these genes were involved in functions
related to regulation of the pro-inflammatory response as defined by the production of tumor necrosis
factor alpha, nitric oxide biosynthetic process, and chemotaxis and chemokine signaling. In contrast,