
Page 88 - Read Online
P. 88
Page 156 Harry et al. Neuroimmunol Neuroinflammation 2020;7:150-65 I http://dx.doi.org/10.20517/2347-8659.2020.07
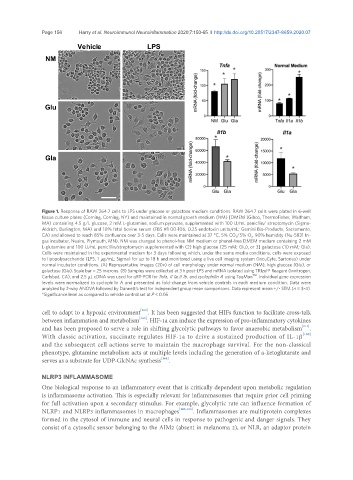
Figure 1. Response of RAW 264.7 cells to LPS under glucose or galactose medium conditions. RAW 264.7 cells were plated in 6-well
tissue culture plates (Corning, Corning, NY) and maintained in normal growth medium (NM) [DMEM (Gibco, ThermoFisher, Waltham,
MA) containing 4.5 g/L glucose, 2 mM L-glutamine, sodium pyruvate, supplemented with 100 U/mL penicllin/ streptomycin (Sigma-
Aldrich, Burlington, MA) and 10% fetal bovine serum (FBS #1 00-106, 0.25 endotoxin units/mL; Gemini Bio-Products, Sacramento,
CA) and allowed to reach 85% confluence over 3-5 days. Cells were maintained at 37 °C, 5% CO 2 /5% O 2 , 90% humidity (Nu-5831 tri-
gas incubator, Nuaire, Plymouth, MN). NM was changed to phenol-free NM medium or phenol-free DMEM medium containing 2 mM
L-glutamine and 100 U/mL penicillin/streptomycin supplemented with (2) high glucose (25 mM; Glu), or 3] galactose (10 mM; Gla).
Cells were maintained in the experimental medium for 3 days following which, under the same media conditions, cells were exposed
to lipopolysaccharide (LPS; 1 μg/mL; Sigma) for up to 18 h and monitored using a live cell imaging system (IncuCyte, Sartorius) under
normal incubator conditions. (A) Representative images (20x) of cell morphology under normal medium (NM), high glucose (Glu), or
galactose (Gla). Scale bar = 25 microns. (B) Samples were collected at 3 h post-LPS and mRNA isolated using TRIzol® Reagent (Invitrogen,
TM
Carlsbad, CA), and 2.5 μL cDNA was used for qRT-PCR for Tnfa, II 1a, II 1b, and cyclophilin A using TaqMan . Individual gene expression
levels were normalized to cyclophilin A and presented as fold-change from vehicle controls in each medium condition. Data were
analyzed by 2-way ANOVA followed by Dunnett’s test for independent group mean comparisons. Data represent mean +/- SEM (n = 3-4).
*Significance level as compared to vehicle control set at P < 0.05
cell to adapt to a hypoxic environment [162] . It has been suggested that HIFs function to facilitate cross-talk
between inflammation and metabolism [163] . HIF-1a can induce the expression of pro-inflammatory cytokines
[114]
and has been proposed to serve a role in shifting glycolytic pathways to favor anaerobic metabolism .
With classic activation, succinate regulates HIF-1a to drive a sustained production of IL-1b [100]
and the subsequent cell actions serve to maintain the macrophage survival. For the non-classical
phenotype, glutamine metabolism acts at multiple levels including the generation of a-ketoglutarate and
serves as a substrate for UDP-GlcNAc synthesis [164] .
NLRP3 INFLAMMASOME
One biological response to an inflammatory event that is critically dependent upon metabolic regulation
is inflammasome activation. This is especially relevant for inflammasomes that require prior cell priming
for full activation upon a secondary stimulus. For example, glycolytic rate can influence formation of
NLRP1 and NLRP3 inflammasomes in macrophages [165,166] . Inflammasomes are multiprotein complexes
formed in the cytosol of immune and neural cells in response to pathogenic and danger signals. They
consist of a cytosolic sensor belonging to the AIM2 (absent in melanoma 2), or NLR, an adaptor protein