
Page 297 - Read Online
P. 297
Ghosh et al. Neuroimmunol Neuroinflammation 2018;5:38 I http://dx.doi.org/10.20517/2347-8659.2018.28 Page 7 of 11
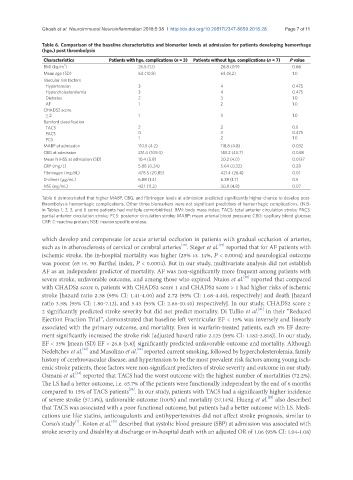
Table 6. Comparison of the baseline characteristics and biomarker levels at admission for patients developing hemorrhage
(hge.) post thrombolysis
Characteristics Patients with hge. complications (n = 3) Patients without hge. complications (n = 7) P value
2
BMI (kg/m ) 26.5 (1.1) 26.8 (0.9) 0.66
Mean age (SD) 64 (10.8) 63 (8.2) 1.0
Vascular risk factors
Hypertension 3 4 0.475
Hypercholesterolemia 3 4 0.475
Diabetes 2 3 1.0
AF 1 2 1.0
CHADS2 score
≥ 2 1 3 1.0
Bamford classification
TACS 2 2 0.5
PACS 0 3 0.475
PCS 1 2 1.0
MABP at admission 110.5 (4.2) 118.8 (4.8) 0.032
CBG at admission 251.4 (109.4) 143.2 (45.7) 0.048
Mean NIHSS at admission (SD) 10.4 (5.8) 20.2 (4.0) 0.0137
CRP (mg/L) 5.88 (0.24) 5.64 (0.32) 0.28
Fibrinogen (mg/dL) 478.5 (20.85) 421.4 (26.4) 0.01
D-dimer (µg/mL) 6.88 (1.4) 6.38 (1.7) 0.5
NSE (ng/mL) 42.1 (11.2) 30.8 (4.8) 0.07
Table 6 demonstrated that higher MABP, CBG, and fibrinogen levels at admission predicted significantly higher chance to develop post-
thrombolysis hemorrhagic complications. Other three biomarkers were not significant predictors of hemorrhagic complications. (N.B-
in Tables 1, 2, 3, and 6 some patients had multiple comorbidities). BMI: body mass index; TACS: total anterior circulation stroke; PACS:
partial anterior circulation stroke; PCS: posterior circulation stroke; MABP: mean arterial blood pressure; CBG: capillary blood glucose;
CRP: C-reactive protein; NSE: neuron specific enolase.
which develop and compensate for acute arterial occlusion in patients with gradual occlusion of arteries,
such as in atherosclerosis of cervical or cerebral arteries . Steger et al. reported that for AF patients with
[18]
[19]
ischemic stroke, the in-hospital mortality was higher (25% vs. 14%, P < 0.0004) and neurological outcome
was poorer (65 vs. 90 Barthel index, P < 0.0004). But in our study, multivariate analysis did not establish
AF as an independent predictor of mortality. AF was non-significantly more frequent among patients with
severe stroke, unfavorable outcome, and among those who expired. Ntaios et al. reported that compared
[20]
with CHADS2 score 0, patients with CHADS2 score 1 and CHADS2 score > 1 had higher risks of ischemic
stroke [hazard ratio 2.38 (95% CI: 1.41-4.00) and 2.72 (95% CI: 1.68-4.40), respectively] and death [hazard
ratio 3.58; (95% CI: 1.80-7.12), and 5.45 (95% CI: 2.86-10.40) respectively]. In our study, CHADS2 score ≥
2 significantly predicted stroke severity but did not predict mortality. Di Tullio et al. in their “Reduced
[21]
Ejection Fraction Trial”, demonstrated that baseline left ventricular EF < 15% was inversely and linearly
associated with the primary outcome, and mortality. Even in warfarin-treated patients, each 5% EF decre-
ment significantly increased the stroke risk [adjusted hazard ratio 2.125 (95% CI: 1.182-3.818)]. In our study,
EF < 35% [mean (SD) EF = 26.8 (5.8)] significantly predicted unfavorable outcome and mortality. Although
[22]
[23]
Nedeltchev et al. and Musolino et al. reported current smoking, followed by hypercholesterolemia, family
history of cerebrovascular disease, and hypertension to be the most prevalent risk factors among young isch-
emic stroke patients, these factors were non-significant predictors of stroke severity and outcome in our study.
[24]
Osmani et al. reported that TACS had the worst outcome with the highest number of mortalities (72.2%).
The LS had a better outcome, i.e. 65.7% of the patients were functionally independent by the end of 6 months
compared to 15% of TACS patients . In our study, patients with TACS had a significantly higher incidence
[24]
[25]
of severe stroke (57.14%), unfavorable outcome (100%) and mortality (57.14%). Huang et al. also described
that TACS was associated with a poor functional outcome, but patients had a better outcome with LS. Medi-
cations use like statins, anticoagulants and antihypertensives did not affect stroke prognosis, similar to
[26]
[7]
Corso’s study . Koton et al. described that systolic blood pressure (SBP) at admission was associated with
stroke severity and disability at discharge or in-hospital death with an adjusted OR of 1.06 (95% CI: 1.04-1.08)