
Page 296 - Read Online
P. 296
Page 6 of 11 Ghosh et al. Neuroimmunol Neuroinflammation 2018;5:38 I http://dx.doi.org/10.20517/2347-8659.2018.28
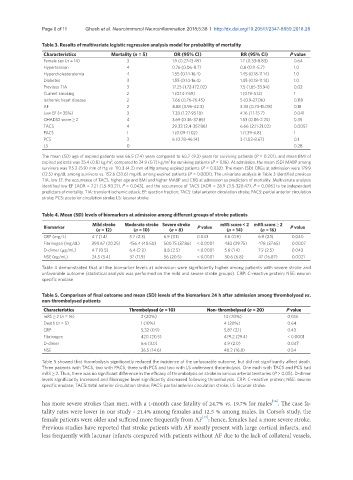
Table 3. Results of multivariate logistic regression analysis model for probability of mortality
Characteristics Mortality (n = 5) OR (95% CI) RR (95% CI) P value
Female sex (n = 14) 3 1.9 (0.27-13.49) 1.7 (0.33-8.83) 0.64
Hypertension 4 0.76 (0.06-8.7) 0.8 (0.11-5.7) 1.0
Hypercholesterolemia 4 1.55 (0.14-16.4) 1.45 (0.18-11.14) 1.0
Diabetes 3 1.55 (0.14-16.4) 1.45 (0.18-11.14) 1.0
Previous TIA 3 17.25 (1.72-172.02) 7.5 (1.65-33.94) 0.02
Current smoking 2 1 (0.14-7.69) 1 (0.19-5.12) 1
Ischemic heart disease 2 7.66 (0.76-76.45) 5 (0.9-27.06) 0.118
AF 2 4.88 (0.96-42.3) 3.33 (0.73-15.08) 0.18
Low EF (< 35%) 3 7.33 (1.27-95.18) 4.16 (1.1-15.7) 0.041
CHADS2 score ≥ 2 4 3.69 (0.36-37.85) 1.53 (0.86-2.74) 0.35
TACS 4 29.33 (2.4-357.86) 6.66 (2.11-21.02) 0.0057
PACS 1 1 (0.09-11.02) 1 (1.39-6.8) 1
PCS 3 6 (0.78-46.14) 3 (1.03-8.67) 0.1
LS 0 0.28
The mean (SD) age of expired patients was 66.5 (7.4) years compared to 60.7 (9.3) years for surviving patients (P = 0.201), and mean BMI of
expired patients was 25.4 (0.8) kg/m , compared to 24.9 (0.7) kg/m for surviving patients (P = 0.16). At admission, the mean (SD) MABP among
2
2
survivors was 115.2 (5.9) mm of Hg vs. 110.3 (4.2) mm of Hg among expired patients (P = 0.033). The mean (SD) CBGs at admission were 179.9
(12.5) mg/dL among survivors vs. 152.6 (20.6) mg/dL among expired patients (P = 0.0001). The univariate analysis in Table 3 identified previous
TIA, low EF, the occurrence of TACS, higher age and BMI and higher MABP and CBG at admission as predictors of mortality. Multivariate analysis
identified low EF [AOR = 7.21 (1.5-90.21), P = 0.043], and the occurrence of TACS [AOR = 28.9 (3.5-320.47), P = 0.006] to be independent
predictors of mortality. TIA: transient ischemic attack; EF: ejection fraction; TACS: total anterior circulation stroke; PACS: partial anterior circulation
stroke; PCS: posterior circulation stroke; LS: lacunar stroke
Table 4. Mean (SD) levels of biomarkers at admission among different groups of stroke patients
Biomarker Mild stroke Moderate stroke Severe stroke P value mRS score < 2 mRS score ≥ 2 P value
(n = 12) (n = 10) (n = 8) (n = 14) (n = 16)
CRP (mg/L) 4.7 (1.4) 5.7 (2.3) 6.9 (3.1) 0.043 5.6 (0.9) 6.9 (2.1) 0.040
Fibrinogen (mg/dL) 390.67 (20.25) 456.4 (40.50) 500.75 (37.86) < 0.0001 430 (29.75) 478 (37.65) 0.0007
D-dimer (µg/mL) 4.7 (0.5) 6.4 (2.2) 8.8 (2.5) < 0.0001 5.6 (1.4) 7.2 (2.5) 0.043
NSE (ng/mL) 24.5 (5.4) 37 (11.9) 56 (20.5) < 0.0001 30.6 (6.8) 47 (16.87) 0.0021
Table 4 demonstrated that all the biomarker levels at admission were significantly higher among patients with severe stroke and
unfavorable outcome (statistical analysis was performed on the mild and severe stroke groups). CRP: C-reactive protein; NSE: neuron
specific enolase
Table 5. Comparison of final outcome and mean (SD) levels of the biomarkers 24 h after admission among thrombolysed vs.
non-thrombolysed patients
Characteristics Thrombolysed (n = 10) Non- thrombolysed (n = 20) P value
mRS ≥ 2 (n = 16) 2 (20%) 14 (70%) 0.018
Death (n = 5) 1 (10%) 4 (20%) 0.64
CRP 5.32 (0.9) 5.87 (2.1) 0.43
Fibrinogen 420 (20.5) 479.2 (29.4) < 0.0001
D-dimer 6.6 (3.0) 4.9 (2.0) 0.047
NSE 36.5 (14.6) 40.2 (16.8) 0.54
Table 5 showed that thrombolysis significantly reduced the incidence of the unfavorable outcome, but did not significantly affect death.
Three patients with TACS, two with PACS, three with PCS and two with LS underwent thrombolysis. One each with TACS and PCS had
mRS ≥ 2. Thus, there was no significant difference in the efficacy of thrombolysis on stroke in various arterial territories (P > 0.05). D-dimer
levels significantly increased and fibrinogen level significantly decreased following thrombolysis. CRP: C-reactive protein; NSE: neuron
specific enolase; TACS: total anterior circulation stroke; PACS: partial anterior circulation stroke; LS: lacunar stroke.
[16]
has more severe strokes than men, with a 1-month case fatality of 24.7% vs. 19.7% for males . The case fa-
tality rates were lower in our study - 21.4% among females and 12.5 % among males. In Corso’s study, the
[17]
female patients were older and suffered more frequently from AF ; hence, females had a more severe stroke.
Previous studies have reported that stroke patients with AF mostly present with large cortical infarcts, and
less frequently with lacunar infarcts compared with patients without AF due to the lack of collateral vessels,