
Page 295 - Read Online
P. 295
Ghosh et al. Neuroimmunol Neuroinflammation 2018;5:38 I http://dx.doi.org/10.20517/2347-8659.2018.28 Page 5 of 11
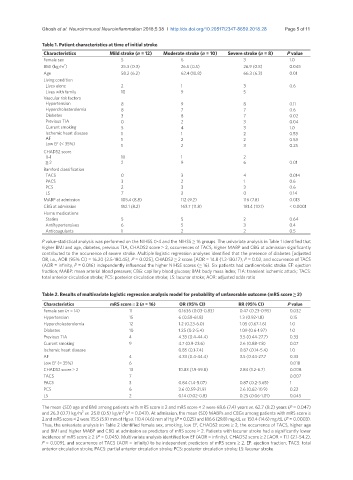
Table 1. Patient characteristics at time of initial stroke
Characteristics Mild stroke (n = 12) Moderate stroke (n = 10) Severe stroke (n = 8) P value
Female sex 5 6 3 1.0
BMI (kg/m ) 25.3 (0.3) 26.5 (0.5) 26.9 (0.8) 0.045
2
Age 58.2 (6.2) 62.4 (10.8) 66.3 (6.3) 0.01
Living condition
Lives alone 2 1 3 0.6
Lives with family 10 9 5
Vascular risk factors
Hypertension 8 9 8 0.11
Hypercholesterolemia 8 7 7 0.6
Diabetes 3 8 7 0.02
Previous TIA 0 2 3 0.04
Current smoking 5 4 3 1.0
Ischemic heart disease 1 1 2 0.53
AF 1 2 2 0.53
Low EF (< 35%) 1 2 3 0.25
CHADS2 score
0-1 10 1 2
≥ 2 2 9 6 0.01
Bamford classification
TACS 0 3 4 0.014
PACS 3 2 1 0.6
PCS 2 3 3 0.6
LS 7 2 0 0.14
MABP at admission 105.4 (8.8) 112 (9.2) 116 (7.8) 0.013
CBG at admission 152.1 (8.2) 163.7 (11.8) 181.4 (10.1) < 0.0001
Home medications
Statins 5 5 2 0.64
Antihypertensives 6 5 3 0.4
Anticoagulants 1 2 2 0.5
P value-statistical analysis was performed on the NIHSS 0-4 and the NIHSS ≥ 16 groups. The univariate analysis in Table 1 identified that
higher BMI and age, diabetes, previous TIA, CHADS2 score ≥ 2, occurrences of TACS, higher MABP and CBG at admission significantly
contributed to the occurrence of severe stroke. Multiple logistic regression analyses identified that the presence of diabetes [adjusted
OR, i.e., AOR (95% CI) = 16.20 (2.5-180.45), P = 0.025], CHADS2 ≥ 2 score [AOR = 14.8 (1.2-130.17), P = 0.02, and occurrence of TACS
(AOR = infinity, P = 0.016) independently influenced the higher NIHSS scores (≥ 16). Six patients had cardioembolic stroke. EF: ejection
fraction; MABP: mean arterial blood pressure; CBG: capillary blood glucose; BMI: body mass index; TIA: transient ischemic attack; TACS:
total anterior circulation stroke; PCS: posterior circulation stroke; LS: lacunar stroke; AOR: adjusted odds ratio
Table 2. Results of multivariate logistic regression analysis model for probability of unfavorable outcome (mRS score ≥ 2)
Characteristics mRS score ≥ 2 (n = 16) OR (95% CI) RR (95% CI) P value
Female sex (n = 14) 11 0.1636 (0.03-0.83) 0.47 (0.23-0.95) 0.032
Hypertension 15 6 (0.58-61.8) 1.3 (0.92-1.8) 0.15
Hypercholesterolemia 12 1.2 (0.23-6.0) 1.05 (0.67-1.6) 1.0
Diabetes 10 1.25 (0.2-5.4) 1.09 (0.6-1.97) 1.0
Previous TIA 4 4.33 (0.4-44.4) 3.5 (0.44-27.7) 0.33
Current smoking 9 4.7 (0.9-23.6) 2.6 (0.88-7.8) 0.07
Ischemic heart disease 0.85 (0.1-7.4) 0.87 (0.14-5.4) 1.0
AF 4 4.33 (0.4-44.4) 3.5 (0.44-27.7 0.33
Low EF (< 35%) 6 0.018
CHADS2 score ≥ 2 13 10.83 (1.9-59.8) 2.84 (1.2-6.7) 0.008
TACS 7 0.007
PACS 3 0.84 (1.4-5.07) 0.87 (0.2-3.65) 1
PCS 6 3.6 (0.59-21.9) 2.6 (0.62-10.9) 0.22
LS 2 0.14 (0.02-0.8) 0.25 (0.06-1.01) 0.045
The mean (SD) age and BMI among patients with mRS score ≥ 2 and mRS score < 2 were 68.6 (7.4) years vs. 62.7 (8.2) years (P = 0.047)
2
and 26.3 (0.7) kg/m vs. 25.8 (0.5) kg/m (P = 0.043). At admission, the mean (SD) MABPs and CBGs among patients with mRS score ≥
2
2 and mRS score < 2 were 115.5 (5.9) mm of Hg vs. 110.4 (4.6) mm of Hg (P = 0.025) and 186.6 (29.8) mg/dL vs. 150.4 (14.6) mg/dL (P = 0.0003).
Thus, the univariate analysis in Table 2 identified female sex, smoking, low EF, CHADS2 score ≥ 2, the occurrence of TACS, higher age
and BMI and higher MABP and CBG at admission as predictors of mRS score ≥ 2. Patients with lacunar stroke had a significantly lower
incidence of mRS score ≥ 2 (P = 0.045). Multivariate analysis identified low EF (AOR = infinity), CHADS2 score ≥ 2 [AOR = 11.1 (2.1-54.2),
P = 0.009], and occurrence of TACS (AOR = infinity) to be independent predictors of mRS score ≥ 2. EF: ejection fraction; TACS: total
anterior circulation stroke; PACS: partial anterior circulation stroke; PCS: posterior circulation stroke; LS: lacunar stroke