
Page 178 - Read Online
P. 178
Arora et al. Neuroimmunol Neuroinflammation 2018;5:26 I http://dx.doi.org/10.20517/2347-8659.2018.11 Page 5 of 8
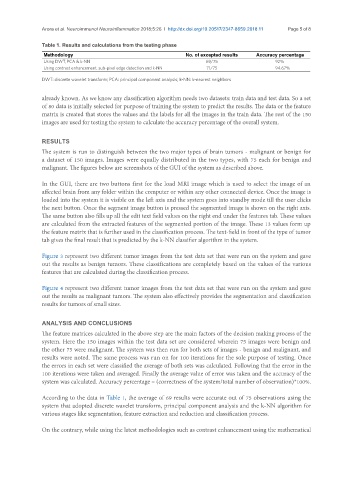
Table 1. Results and calculations from the testing phase
Methodology No. of excepted results Accuracy percentage
Using DWT, PCA & k-NN 69/75 92%
Using contrast enhancement, sub-pixel edge detection and k-NN 71/75 94.67%
DWT: discrete wavelet transform; PCA: principal component analysis; k-NN: k-nearest neighbors
already known. As we know any classification algorithm needs two datasets: train data and test data. So a set
of 80 data is initially selected for purpose of training the system to predict the results. The data or the feature
matrix is created that stores the values and the labels for all the images in the train data. The rest of the 150
images are used for testing the system to calculate the accuracy percentage of the overall system.
RESULTS
The system is run to distinguish between the two major types of brain tumors - malignant or benign for
a dataset of 150 images. Images were equally distributed in the two types, with 75 each for benign and
malignant. The figures below are screenshots of the GUI of the system as described above.
In the GUI, there are two buttons first for the load MRI image which is used to select the image of an
affected brain from any folder within the computer or within any other connected device. Once the image is
loaded into the system it is visible on the left axis and the system goes into standby mode till the user clicks
the next button. Once the segment image button is pressed the segmented image is shown on the right axis.
The same button also fills up all the edit text field values on the right end under the features tab. These values
are calculated from the extracted features of the segmented portion of the image. These 13 values form up
the feature matrix that is further used in the classification process. The text-field in front of the type of tumor
tab gives the final result that is predicted by the k-NN classifier algorithm in the system.
Figure 3 represent two different tumor images from the test data set that were run on the system and gave
out the results as benign tumors. These classifications are completely based on the values of the various
features that are calculated during the classification process.
Figure 4 represent two different tumor images from the test data set that were run on the system and gave
out the results as malignant tumors. The system also effectively provides the segmentation and classification
results for tumors of small sizes.
ANALYSIS AND CONCLUSIONS
The feature matrices calculated in the above step are the main factors of the decision making process of the
system. Here the 150 images within the test data set are considered wherein 75 images were benign and
the other 75 were malignant. The system was then run for both sets of images - benign and malignant, and
results were noted. The same process was run on for 100 iterations for the sole purpose of testing. Once
the errors in each set were classified the average of both sets was calculated. Following that the error in the
100 iterations were taken and averaged. Finally the average value of error was taken and the accuracy of the
system was calculated. Accuracy percentage = (correctness of the system/total number of observation)*100%.
According to the data in Table 1, the average of 69 results were accurate out of 75 observations using the
system that adopted discrete wavelet transform, principal component analysis and the k-NN algorithm for
various stages like segmentation, feature extraction and reduction and classification process.
On the contrary, while using the latest methodologies such as contrast enhancement using the mathematical