
Page 43 - Read Online
P. 43
Fabbrini et al. Microbiome Res Rep 2023;2:25 https://dx.doi.org/10.20517/mrr.2023.25 Page 13 of 18
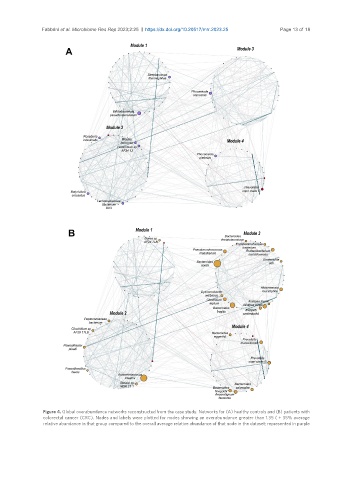
Figure 4. Global overabundance networks reconstructed from the case study. Networks for (A) healthy controls and (B) patients with
colorectal cancer (CRC). Nodes and labels were plotted for nodes showing an overabundance greater than 1.35 ( + 35% average
relative abundance in that group compared to the overall average relative abundance of that node in the dataset; represented in purple