
Page 62 - Read Online
P. 62
Sawada et al. Mini-invasive Surg 2021;5:6 I http://dx.doi.org/10.20517/2574-1225.2020.100 Page 5 of 11
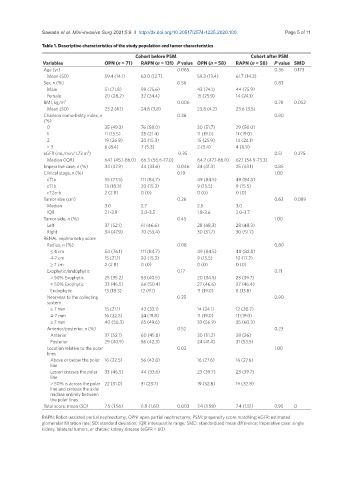
Table 1. Descriptive characteristics of the study population and tumor characteristics
Cohort before PSM Cohort after PSM
Variables OPN (n = 71) RAPN (n = 131) P value OPN (n = 58) RAPN (n = 58) P value SMD
Age (yr) 0.065 0.36 0.173
Mean (SD) 59.4 (14.1) 63.0 (12.7) 59.3 (13.4) 61.7 (14.3)
Sex, n (%) 0.56 0.83
Male 51 (71.8) 99 (75.6) 43 (74.1) 44 (75.9)
Female 20 (28.2) 32 (24.4) 15 (25.9) 14 (24.1)
BMI, kg/m 2 0.006 0.78 0.052
Mean (SD) 23.2 (4.1) 24.8 (3.8) 23.8 (4.2) 23.6 (3.5)
Charlson comorbidity index, n 0.36 0.90
(%)
0 35 (49.3) 76 (58.0) 30 (51.7) 29 (50.0)
1 11 (15.5) 28 (21.4) 11 (19.0) 11 (19.0)
2 19 (26.8) 20 (15.3) 15 (25.9) 14 (24.1)
≥ 3 6 (8.4) 7 (5.3) 2 (3.4) 4 (6.9)
2
eGFR (mL/min/1.73 m ) 0.35 0.51 0.275
Median (IQR) 64.1 (45.1-86.0) 66.3 (56.6-77.0) 64.7 (47.1-86.0) 62.1 (54.9-73.3)
Imperative case, n (%) 34 (47.9) 44 (33.6) 0.046 24 (41.3) 25 (43.1) 0.85
Clinical stage, n (%) 0.19 1.00
cT1a 55 (77.5) 111 (84.7) 49 (84.5) 49 (84.5)
cT1b 13 (18.3) 20 (15.3) 9 (15.5) 9 (15.5)
cT2a-b 2 (2.8) 0 (0) 0 (0) 0 (0)
Tumor size (cm) 0.26 0.63 0.089
Median 3.0 2.7 2.5 3.0
IQR 2.1-3.9 2.0-3.5 1.8-3.6 2.0-3.7
Tumor side, n (%) 0.45 1.00
Left 37 (52.1) 61 (46.6) 28 (48.3) 28 (48.3)
Right 34 (47.9) 70 (53.4) 30 (51.7) 30 (51.7)
RENAL nephrometry score
Radius, n (%) 0.08 0.80
≤ 4 cm 54 (76.1) 111 (84.7) 49 (84.5) 48 (82.8)
4-7 cm 15 (21.1) 20 (15.3) 9 (15.5) 10 (17.2)
≥ 7 cm 2 (2.8) 0 (0) 0 (0) 0 (0)
Exophytic/endophytic 0.17 0.71
≥ 50% Exophytic 25 (35.2) 53 (40.5) 20 (34.5) 23 (39.7)
< 50% Exophytic 33 (46.5) 66 (50.4) 27 (46.6) 27 (46.4)
Endophytic 13 (18.3) 12 (9.1) 11 (19.0) 8 (13.8)
Nearness to the collecting 0.25 0.90
system
≥ 7 mm 15 (21.1) 42 (32.1) 14 (24.1) 12 (20.7)
4-7 mm 16 (22.5) 24 (19.8) 11 (19.0) 11 (19.0)
≤ 7 mm 40 (56.3) 65 (49.6) 33 (56.9) 35 (60.3)
Anterior/posterior, n (%) 0.52 0.23
Anterior 37 (52.1) 60 (45.8) 30 (51.2) 28 (26)
Posterior 29 (40.9) 56 (42.3) 24 (41.4) 31 (53.5)
Location relative to the polar 0.02 1.00
lines
Above or below the polar 16 (22.5) 56 (42.8) 16 (27.6) 16 (27.6)
line
Lesion crosses the polar 33 (46.5) 44 (33.6) 23 (39.7) 23 (39.7)
line
> 50% is across the polar 22 (31.0) 31 (23.7) 19 (32.8) 19 (32.8)
line and crosses the axial
midline entirely between
the polar lines
Total score, mean (SD) 7.5 (1.56) 6.8 (1.61) 0.003 7.4 (1.58) 7.4 (1.51) 0.95 0
RAPN: Robot-assisted partial nephrectomy; OPN: open partial nephrectomy; PSM: propensity score matching; eGFR: estimated
glomerular filtration rate; SD: standard deviation; IQR: interquartile range; SMD: standardized mean difference; Imperative case: single
kidney, bilateral tumors, or chronic kidney disease (eGFR < 60).