
Page 478 - Read Online
P. 478
Page 6 of 9 Campobasso et al. Mini-invasive Surg 2021;5:45 https://dx.doi.org/10.20517/2574-1225.2021.92
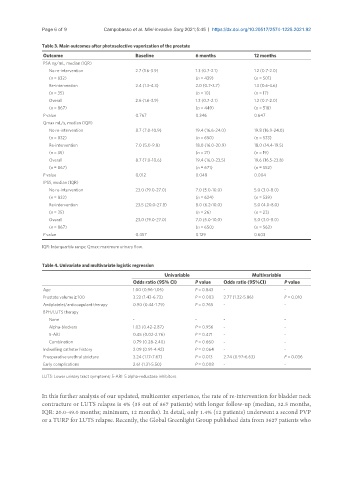
Table 3. Main outcomes after photoselective vaporization of the prostate
Outcome Baseline 6 months 12 months
PSA ng/mL, median (IQR)
No re-intervention 2.7 (1.6-3.9) 1.3 (0.7-2.1) 1.2 (0.7-2.0)
(n = 832) (n = 439) (n = 501)
Re-intervention 2.4 (1.3-4.3) 2.0 (0.7-3.7) 1.3 (0.6-3.6)
(n = 35) (n = 10) (n = 17)
Overall 2.6 (1.6-3.9) 1.3 (0.7-2.1) 1.2 (0.7-2.0)
(n = 867) (n = 449) (n = 518)
P value 0.767 0.346 0.647
Qmax mL/s, median (IQR)
No re-intervention 8.7 (7.0-10.9) 19.4 (16.6-24.0) 19.8 (16.9-24.0)
(n = 832) (n = 650) (n = 533)
Re-intervention 7.0 (5.0-9.8) 18.0 (16.0-20.9) 18.0 (14.4-19.5)
(n = 35) (n = 21) (n = 19)
Overall 8.7 (7.0-10.6) 19.4 (16.0-23.5) 19.6 (16.5-23.8)
(n = 867) (n = 671) (n = 552)
P value 0.012 0.048 0.004
IPSS, median (IQR)
No re-intervention 23.0 (19.0-27.0) 7.0 (5.0-10.0) 5.0 (3.0-8.0)
(n = 832) (n = 624) (n = 539)
Re-intervention 23.5 (20.0-27.8) 8.0 (6.2-10.0) 5.0 (4.0-8.0)
(n = 35) (n = 26) (n = 23)
Overall 23.0 (19.0-27.0) 7.0 (5.0-10.0) 5.0 (3.0-8.0)
(n = 867) (n = 650) (n = 562)
P value 0.457 0.129 0.603
IQR: Interquartile range; Qmax: maximum urinary flow.
Table 4. Univariate and multivariate logistic regression
Univariable Multivariable
Odds ratio (95% CI) P value Odds ratio (95%CI) P value
Age 1.00 (0.96-1.05) P = 0.843 - -
Prostate volume ≥ 100 3.22 (1.43-6.73) P = 0.003 2.77 (1.22-5.86) P = 0.010
Antiplatelet/anticoagulant therapy 0.90 (0.44-1.79) P = 0.765 - -
BPH/LUTS therapy
None - - - -
Alpha-blockers 1.03 (0.42-2.87) P = 0.956 - -
5-ARI 0.45 (0.02-2.76) P = 0.471 - -
Combination 0.79 (0.28-2.40) P = 0.660 - -
Indwelling catheter history 2.09 (0.91-4.42) P = 0.064 - -
Preoperative urethral stricture 3.24 (1.17-7.67) P = 0.013 2.74 (0.97-6.63) P = 0.036
Early complications 2.61 (1.31-5.50) P = 0.008 - -
LUTS: Lower urinary tract symptoms; 5-ARI: 5 alpha-reductase inhibitors.
In this further analysis of our updated, multicenter experience, the rate of re-intervention for bladder neck
contracture or LUTS relapse is 4% (35 out of 867 patients) with longer follow-up (median, 32.5 months,
IQR: 20.0-49.0 months; minimum, 12 months). In detail, only 1.4% (12 patients) underwent a second PVP
or a TURP for LUTS relapse. Recently, the Global Greenlight Group published data from 3627 patients who