
Page 476 - Read Online
P. 476
Page 4 of 9 Campobasso et al. Mini-invasive Surg 2021;5:45 https://dx.doi.org/10.20517/2574-1225.2021.92
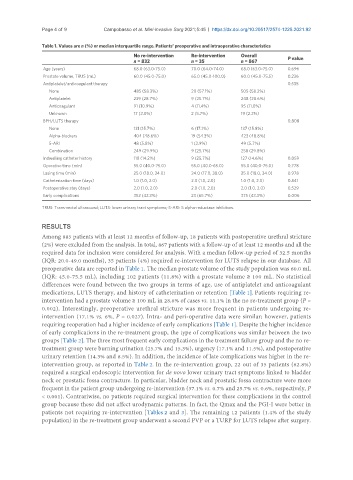
Table 1. Values are n (%) or median interquartile range. Patients’ preoperative and intraoperative characteristics
No re-intervention Re-intervention Overall P value
n = 832 n = 35 n = 867
Age (years) 68.0 (63.0-75.0) 70.0 (64.0-74.0) 68.0 (63.0-75.0) 0.696
Prostate volume, TRUS (mL) 60.0 (45.0-75.0) 65.0 (45.0-100.0) 60.0 (45.0-75.5) 0.236
Antiplatelet/anticoagulant therapy 0.535
None 485 (58.3%) 20 (57.1%) 505 (58.2%)
Antiplatelet 239 (28.7%) 9 (25.7%) 248 (28.6%)
Anticoagulant 91 (10.9%) 4 (11.4%) 95 (11.0%)
Unknown 17 (2.0%) 2 (5.7%) 19 (2.2%)
BPH/LUTS therapy 0.808
None 131 (15.7%) 6 (17.1%) 137 (15.8%)
Alpha-blockers 404 (48.6%) 19 (54.3%) 423 (48.8%)
5-ARI 48 (5.8%) 1 (2.9%) 49 (5.7%)
Combination 249 (29.9%) 9 (25.7%) 258 (29.8%)
Indwelling catheter history 118 (14.2%) 9 (25.7%) 127 (14.6%) 0.059
Operative time (min) 55.0 (40.0-75.0) 55.0 (40.0-65.0) 55.0 (40.0-75.0) 0.778
Lasing time (min) 25.0 (18.0, 34.0) 24.0 (17.0, 38.0) 25.0 (18.0, 34.0) 0.978
Catheterization time (days) 1.0 (1.0, 2.0) 2.0 (1.0, 2.0) 1.0 (1.0, 2.0) 0.841
Postoperative stay (days) 2.0 (1.0, 2.0) 2.0 (1.0, 2.0) 2.0 (1.0, 2.0) 0.529
Early complications 352 (42.3%) 23 (65.7%) 375 (43.3%) 0.006
TRUS: Trans-rectal ultrasound; LUTS: lower urinary tract symptoms; 5-ARI: 5 alpha-reductase inhibitors.
RESULTS
Among 885 patients with at least 12 months of follow-up, 18 patients with postoperative urethral stricture
(2%) were excluded from the analysis. In total, 867 patients with a follow-up of at least 12 months and all the
required data for inclusion were considered for analysis. With a median follow-up period of 32.5 months
(IQR: 20.0-49.0 months), 35 patients (4%) required re-intervention for LUTS relapse in our database. All
preoperative data are reported in Table 1. The median prostate volume of the study population was 60.0 mL
(IQR: 45.0-75.5 mL), including 102 patients (11.8%) with a prostate volume ≥ 100 mL. No statistical
differences were found between the two groups in terms of age, use of antiplatelet and anticoagulant
medications, LUTS therapy, and history of catheterization or retention [Table 1]. Patients requiring re-
intervention had a prostate volume ≥ 100 mL in 28.6% of cases vs. 11.1% in the no re-treatment group (P =
0.002). Interestingly, preoperative urethral stricture was more frequent in patients undergoing re-
intervention (17.1% vs. 6%, P = 0.027). Intra- and peri-operative data were similar; however, patients
requiring reoperation had a higher incidence of early complications [Table 1]. Despite the higher incidence
of early complications in the re-treatment group, the type of complications was similar between the two
groups [Table 2]. The three most frequent early complications in the treatment failure group and the no re-
treatment group were burning urination (25.7% and 15.3%), urgency (17.1% and 11.5%), and postoperative
urinary retention (14.3% and 8.5%). In addition, the incidence of late complications was higher in the re-
intervention group, as reported in Table 2. In the re-intervention group, 22 out of 35 patients (62.8%)
required a surgical endoscopic intervention for de novo lower urinary tract symptoms linked to bladder
neck or prostatic fossa contracture. In particular, bladder neck and prostatic fossa contracture were more
frequent in the patient group undergoing re-intervention (37.1% vs. 0.7% and 25.7% vs. 0.6%, respectively, P
< 0.001). Contrariwise, no patients required surgical intervention for these complications in the control
group because these did not affect urodynamic patterns. In fact, the Qmax and the PGI-I were better in
patients not requiring re-intervention [Tables 2 and 3]. The remaining 12 patients (1.4% of the study
population) in the re-treatment group underwent a second PVP or a TURP for LUTS relapse after surgery.