
Page 398 - Read Online
P. 398
Page 4 of 8 Kheirvari et al. Mini-invasive Surg 2021;5:40 https://dx.doi.org/10.20517/2574-1225.2021.66
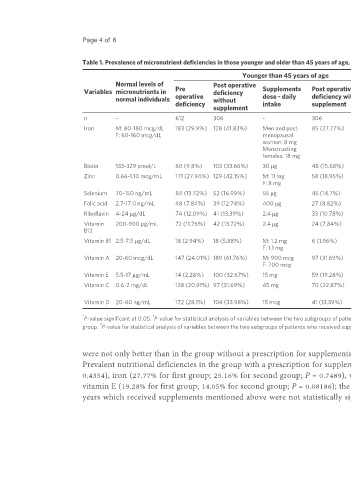
Table 1. Prevalence of micronutrient deficiencies in those younger and older than 45 years of age, with or without a prescription for supplements before surgery and at 12 months after LSG
Younger than 45 years of age Older than 45 years of age
Normal levels of Post operative Post operative
Variables micronutrients in Pre deficiency Supplements Post operative 1 Pre deficiency Supplements Post operative 2
normal individuals operative without dose - daily deficiency with P-value operative without dose - daily deficiency with P-value
deficiency intake supplement deficiency intake supplement
supplement supplement
n - 612 306 - 306 - 612 306 - 306 -
Iron M: 80-180 mcg/dL 183 (29.9%) 128 (41.83%) Men and post- 85 (27.77%) 0.00026* 159 136 (44.44%) 18 mg 77 (25.16%) < 0.00001*
F: 60-160 mcg/dL menopausal (25.98%)
women: 8 mg
Menstruating
females: 18 mg
Biotin 133-329 pmol/L 60 (9.8%) 103 (33.66%) 30 μg 48 (15.68%) < 0.00001* 66 (10.78%) 116 (37.9%) 30 μg 32 (10.45%) < 0.00001*
Zinc 0.66-1.10 mcg/mL 171 (27.94%) 129 (42.15%) M: 11 mg 58 (18.95%) < 0.00001* 171 (27.94%) 134 (43.79%) 11 mg 55 (17.94%) < 0.00001*
F: 8 mg
Selenium 70-150 ng/mL 84 (13.72%) 52 (16.99%) 55 μg 45 (14.7%) 0.4413 91 (14.86%) 61 (19.93%) 55 μg 48 (15.68%) 0.1706
Folic acid 2.7-17.0 ng/mL 48 (7.84%) 39 (12.74%) 400 μg 27 (8.82%) 0.1187 55 (8.98%) 42 (13.72%) 400 μg 25 (8.16%) 0.0278*
Riboflavin 4-24 µg/dL 74 (12.09%) 41 (13.39%) 2.4 μg 33 (10.78%) 0.3221 79 (12.90%) 46 (15.03%) 2.4 μg 26 (8.49%) 0.0120*
Vitamin 200-900 pg/mL 72 (11.76%) 42 (13.72%) 2.4 μg 24 (7.84%) 0.018* 96 (15.68%) 60 (19.6%) 2.4 μg 39 (12.74%) 0.0208*
B12
Vitamin B1 2.5-7.5 μg/dL 18 (2.94%) 18 (5.88%) M: 1.2 mg 6 (1.96%) 0.012* 23 (3.75%) 25 (8.16%) M: 1.2 mg 15 (4.9%) 0.101
F: 1.1 mg F: 1.1 mg
Vitamin A 20-60 mcg/dL 147 (24.01%) 189 (61.76%) M: 900 mcg 97 (31.69%) < 0.00001* 158 (25.81%) 180 (58.82%) M: 900 mcg 82 (26.79%) < 0.00001*
F: 700 mcg F: 700 mcg
Vitamin E 5.5-17 µg/mL 14 (2.28%) 100 (32.67%) 15 mg 59 (19.28%) 0.00016* 153 (25%) 97 (31.69%) 15 mg 43 (14.05%) < 0.00001*
Vitamin C 0.6-2 mg/dL 128 (20.91%) 97 (31.69%) 45 mg 70 (22.87%) 0.014* 145 94 (30.71%) 45 mg 67 (21.89%) 0.01314*
(23.69%)
Vitamin D 20-40 ng/mL 172 (28.1%) 104 (33.98%) 15 mcg 41 (13.39%) < 0.00001* 141 (23.03%) 150 (49.01%) 20 mcg 66 (21.56%) < 0.00001*
* 1
P-value significant at 0.05. P-value for statistical analysis of variables between the two subgroups of patients who received supplements and patients who did not receive supplements in the younger than 45 years
2
group. P-value for statistical analysis of variables between the two subgroups of patients who received supplements and patients who did not receive supplements in the older than 45 years group.
were not only better than in the group without a prescription for supplements postoperative, but also better than their evaluations preoperatively [Table 1].
Prevalent nutritional deficiencies in the group with a prescription for supplements were in vitamin A (31.69% for first group; 26.79% for second group; P =
0.4354), iron (27.77% for first group; 25.16% for second group; P = 0.7489), vitamin C (22.87% for first group; 21.89% for second group; P = 0.7718), and
vitamin E (19.28% for first group; 14.05% for second group; P = 0.08186); the P-values for these variables in the groups of those younger and older than 45
years which received supplements mentioned above were not statistically significant. The analysis of the data revealed that the reduction of nutritional