
Page 341 - Read Online
P. 341
Maalouly et al. Mini-invasive Surg 2021;5:35 https://dx.doi.org/10.20517/2574-1225.2021.57 Page 7 of 12
Table 3. Radiation exposure recorded from the study
Mean effective dose from O-arm spin 8.2 ± 3.74 mSv
Mean fluoroscopy dose 16.32 ± 13.22 s
Mean fluoro time in preoperative CT protocol (for integration) 54 s
CT: Computed tomography.
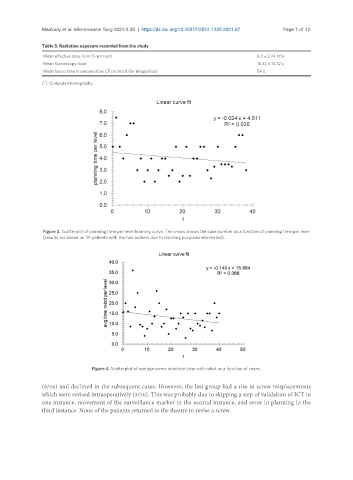
Figure 3. Scatterplot of planning time per level learning curve. The x-axis shows the case number as a function of planning time per level
(results are based on 39 patients with the two outliers due to teaching purposes eliminated).
Figure 4. Scatterplot of average screw insertion time with robot as a function of cases.
(6/56) and declined in the subsequent cases. However, the last group had a rise in screw misplacements
which were revised intraoperatively (3/50). This was probably due to skipping a step of validation of ICT in
one instance, movement of the surveillance marker in the second instance, and error in planning in the
third instance. None of the patients returned to the theatre to revise a screw.