
Page 109 - Read Online
P. 109
Page 4 of 12 Young et al. Mini-invasive Surg 2018;2:16 I http://dx.doi.org/10.20517/2574-1225.2017.50
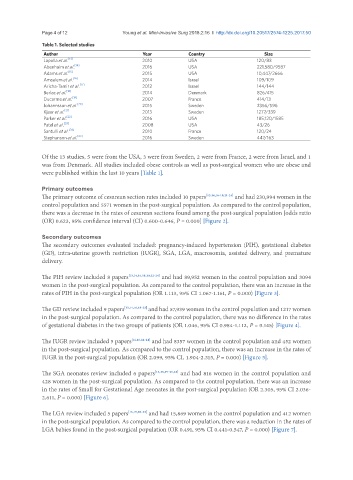
Table 1. Selected studies
Author Year Country Size
Lapolla et al. [13] 2010 USA 120/83
Abenhaim et al. [14] 2016 USA 221,580/9587
Adams et al. [15] 2015 USA 10,447/2666
Amsalem et al. [16] 2014 Israel 109/109
Aricha-Tamir et al. [17] 2012 Israel 144/144
Berlac et al. [18] 2014 Denmark 826/415
Ducarme et al. [19] 2007 France 414/13
Johannsson et al. [20] 2015 Sweden 2356/596
Kjaer et al. [21] 2013 Sweden 1277/339
Parker et al. [22] 2016 USA 185,120/1585
Patel et al. [23] 2008 USA 43/26
Santulli et al. [24] 2010 France 120/24
Stephanson et al. [25] 2016 Sweden 447/163
Of the 13 studies, 5 were from the USA, 3 were from Sweden, 2 were from France, 2 were from Israel, and 1
was from Denmark. All studies included obese controls as well as post-surgical women who are obese and
were published within the last 10 years [Table 1].
Primary outcomes
The primary outcome of cesarean section rates included 10 papers [13,14,16-19,21-24] and had 230,994 women in the
control population and 5571 women in the post-surgical population. As compared to the control population,
there was a decrease in the rates of cesarean sections found among the post-surgical population [odds ratio
(OR) 0.623, 95% confidence interval (CI) 0.600-0.646, P = 0.000] [Figure 2].
Secondary outcomes
The secondary outcomes evaluated included: pregnancy-induced hypertension (PIH), gestational diabetes
(GD), intra-uterine growth restriction (IUGR), SGA, LGA, macrosomia, assisted delivery, and premature
delivery.
The PIH review included 8 papers [13,14,16,18,19,22-24] and had 89,952 women in the control population and 3094
women in the post-surgical population. As compared to the control population, there was an increase in the
rates of PIH in the post-surgical population (OR 1.113, 95% CI 1.067-1.161, P = 0.000) [Figure 3].
The GD review included 9 papers [13,14,16,18-23] and had 57,939 women in the control population and 1217 women
in the post-surgical population. As compared to the control population, there was no difference in the rates
of gestational diabetes in the two groups of patients (OR 1.046, 95% CI 0.984-1.112, P = 0.145) [Figure 4].
The IUGR review included 5 papers [14,16,22-24] and had 8357 women in the control population and 452 women
in the post-surgical population. As compared to the control population, there was an increase in the rates of
IUGR in the post-surgical population (OR 2.099, 95% CI, 1.904-2.315, P = 0.000) [Figure 5].
The SGA neonates review included 6 papers [13,15,19-21,23] and had 816 women in the control population and
428 women in the post-surgical population. As compared to the control population, there was an increase
in the rates of Small for Gestational Age neonates in the post-surgical population (OR 2.305, 95% CI 2.036-
2.611, P = 0.000) [Figure 6].
The LGA review included 5 papers [13,15,20-22] and had 15,869 women in the control population and 412 women
in the post-surgical population. As compared to the control population, there was a reduction in the rates of
LGA babies found in the post-surgical population (OR 0.491, 95% CI 0.441-0.547, P = 0.000) [Figure 7].