
Page 31 - Read Online
P. 31
Kitamura et al. Mini-invasive Surg 2022;6:44 https://dx.doi.org/10.20517/2574-1225.2022.27 Page 5 of 9
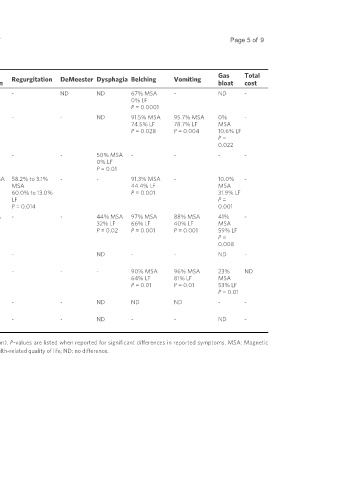
Table 1. Summary of comparative studies
Follow-up GERD- PPI Gas Total
References Year Study design MSA/LF Regurgitation DeMeester Dysphagia Belching Vomiting
(months) HRQL cessation bloat cost
[20]
Louie et al. 2014 Retrospective case-control 34/32 6-10 ND - - ND ND 67% MSA - ND -
0% LF
P = 0.0001
Reynolds 2015 Retrospective propensity- 50/50 12 ND ND - - ND 91.5% MSA 95.7% MSA 0% -
[14]
et al. matched 74.5% LF 78.7% LF MSA
P = 0.028 P = 0.004 10.6% LF
P =
0.022
[21]
Sheu et al. 2015 Retrospective case-control 12/12 7 - - - - 50% MSA - - - -
0% LF
P = 0.01
[22]
Riegler et al. 2015 Prospective multicenter 202/47 12 ND 81.8% MSA 58.2% to 3.1% - - 91.3% MSA - 10.0% -
cohort 63.0% LF MSA 44.4% LF MSA
P = 0.03 60.0% to 13.0% P = 0.001 31.9% LF
LF P =
P = 0.014 0.001
Warren 2016 Retrospective multicenter 114/114 12 ND 75% MSA - - 44% MSA 97% MSA 88% MSA 41% -
[23]
et al. propensity-matched 88% LF 32% LF 66% LF 40% LF MSA
P = 0.02 P = 0.02 P = 0.001 P = 0.001 59% LF
P =
0.008
[9]
Asti et al. 2016 Retrospective propensity- 135/103* 12-80 ND ND - ND - - ND -
matched
Reynolds 2016 Retrospective cohort 52/67 12 ND ND - - - 90% MSA 96% MSA 23% ND
[8]
et al. 64% LF 81% LF MSA
P = 0.01 P = 0.01 53% LF
P = 0.01
Bonavina 2021 Prospective multicenter 465/166 36 ND ND - - ND ND ND - -
[4]
et al. cohort
O’ Neill 2022 Retrospective cohort 25/45 62-69 ND ND - - ND - - ND -
[24]
et al.
*MSA was compared to laparoscopic Toupet fundoplication for this study (versus Nissen Fundoplication). P-values are listed when reported for significant differences in reported symptoms. MSA: Magnetic
sphincter augmentation; LF: laparoscopic fundoplication; GERD-HRQL: gastroesophageal reflux disease-health-related quality of life; ND: no difference.
and 7.4%, respectively [Table 2].
[27]