Page 51 - Read Online
P. 51

Phillips et al. Mini-invasive Surg 2020;4:12  I  http://dx.doi.org/10.20517/2574-1225.2020.02                                         Page 5 of 9


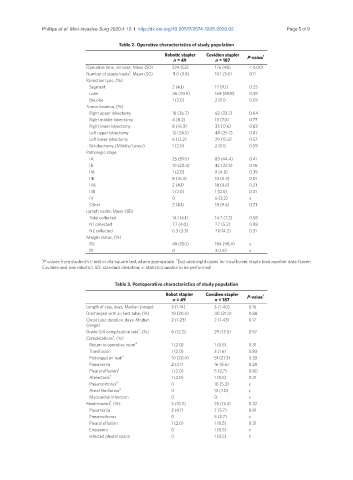
                                         Table 2. Operative characteristics of study population
                                                         Robotic stapler  Covidien stapler  1
                                                           n = 49         n = 187   P-value
                              Operative time, minutes, Mean (SD)  224 (55)  176 (48)  < 0.001
                                             2
                              Number of staple loads , Mean (SD)  11.0 (3.8)  10.1 (3.6)  0.11
                              Resection type, (%)
                                 Segment                   2 (4.1)        17 (9.1)   0.25
                                 Lobe                      46 (93.9)      168 (89.8)  0.39
                                 Bi-Lobe                   1 (2.0)        2 (1.1)    0.59
                              Tumor location, (%)
                                 Right upper lobectomy     18 (36.7)      62 (33.2)  0.64
                                 Right middle lobectomy    4 (8.2)        13 (7.0)   0.77
                                 Right lower lobectomy     8 (16.3)       33 (17.6)  0.83
                                 Left upper lobectomy      12 (24.5)      48 (25.7)  0.87
                                 Left lower lobectomy      6 (12.2)       29 (15.5)  0.57
                                 Bi-lobectomy (Middle/Lower)  1 (2.0)     2 (1.1)    0.59
                              Pathologic stage
                                 IA                        25 (51.0)      83 (44.4)  0.41
                                 IB                        10 (20.4)      42 (22.5)  0.76
                                 IIA                       1 (2.0)        9 (4.8)    0.39
                                 IIB                       8 (16.3)       10 (5.3)   0.01
                                 IIIA                      2 (4.1)        18 (9.6)   0.21
                                 IIIB                      1 (2.0)        1 (0.5)    0.31
                                 IV                        0              6 (3.2)    x
                                 Other                     2 (4.1)        18 (9.6)   0.21
                              Lymph nodes, Mean (SD)
                                 Total collected           14.1 (6.1)     14.7 (7.2)  0.58
                                 N1 collected              7.7 (4.0)      7.7 (5.2)  0.98
                                 N2 collected              6.3 (3.3)      7.0 (4.2)  0.31
                              Margin status, (%)
                                 R0                        49 (100)       184 (98.4)  x
                                 R1                        0              3 (1.6)    x
                                                            2
               1 P-values from student’s t-test or chi-square test where appropriate.  Excluded eight cases for insufficient staple load number data (seven
               Covidien and one robotic). SD: standard deviation; x: statistics unable to be performed

                                        Table 3. Postoperative characteristics of study population
                                                         Robot stapler  Covidien stapler  1
                                                           n = 49        n = 187    P-value
                              Length of stay, days, Median (range)  3 (1-14)  3 (1-40)  0.16
                              Discharged with a chest tube, (%)  10 (20.4)  40 (21.4)  0.88
                              Chest tube duration, days, Median   2 (1-23)  2 (1-43)  0.17
                              (range)
                                                2
                              Grade 3/4 complication rate , (%)  6 (12.2)  29 (15.5)  0.57
                                       3
                              Complications , (%)
                                 Return to operative room 4  1 (2.0)     1 (0.5)     0.31
                                 Transfusion               1 (2.0)       3 (1.6)     0.83
                                 Prolonged air leak 5      10 (20.4)     51 (27.3)   0.33
                                 Pneumonia                 2 (4.1)       16 (8.6)    0.29
                                 Pleural effusion 6        1 (2.0)       5 (2.7)     0.80
                                 Atelectasis 7             1 (2.0)       1 (0.5)     0.31
                                 Pneumothorax 8            0             10 (5.3)    x
                                 Atrial fibrillation 9     0             13 (7.0)    x
                                 Myocardial infarction     0             0           x
                                      3
                              Readmission , (%)            5 (10.2)      25 (13.4)   0.32
                                 Pneumonia                 2 (4.1)       7 (3.7)     0.91
                                 Pneumothorax              0             5 (2.7)     x
                                 Pleural effusion          1 (2.0)       1 (0.5)     0.31
                                 Empyema                   0             1 (0.5)     x
                                 Infected pleural space    0             1 (0.5)     x
   46   47   48   49   50   51   52   53   54   55   56