
Page 21 - Read Online
P. 21
Page 8 of 13 Lesch et al. Mini-invasive Surg 2023;7:25 https://dx.doi.org/10.20517/2574-1225.2023.31
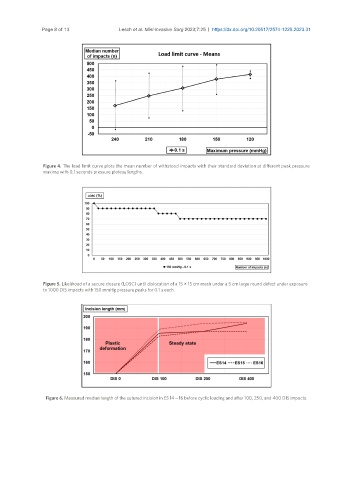
Figure 4. The load limit curve plots the mean number of withstood impacts with their standard deviation at different peak pressure
maxima with 0.1 seconds pressure plateau lengths.
Figure 5. Likelihood of a secure closure (LOSC) until dislocation of a 15 × 15 cm mesh under a 5 cm large round defect under exposure
to 1000 DIS impacts with 150 mmHg pressure peaks for 0.1 s each.
Figure 6. Measured median length of the sutured incision in ES 14 – 16 before cyclic loading and after 100, 250, and 400 DIS impacts.