
Page 58 - Read Online
P. 58
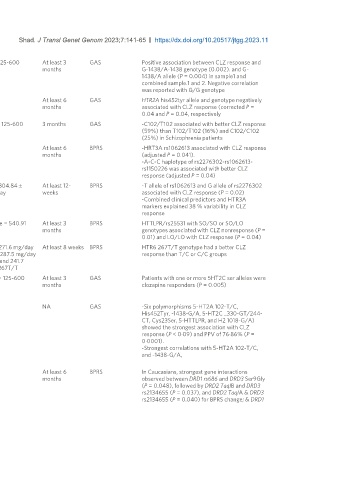
Page 148  Shad. J Transl Genet Genom 2023;7:141-65    https://dx.doi.org/10.20517/jtgg.2023.11


 Arranz et al.,   HTR2A G-1438A (rs6311)  274  Caucasian   Dose range 125-600   At least 3   GAS  Positive association between CLZ response and
 [73]
 1998  mg/day   months                             G-1438/A-1438 genotype (0.002). and G-
                                                   1438/A allele (P = 0.004) in sample1 and
                                                   combined sample.1 and 2. Negative correlation
                                                   was reported with G/G genotype
 Masellis et al.,   HTR2A His452Tyr (rs6314) 185  Caucasian, African   NA  At least 6   GAS  HTR2A his452tyr allele and genotype negatively
 [74]
 1998  American, and Asians   months               associated with CLZ response (corrected P =
                                                   0.04 and P = 0.04, respectively

 Arranz et al.,   HTR2A T102C (rs6313)  149  European Caucasian  Dose range - 125-600   3 months  GAS  -C102/T102 associated with better CLZ response
 [75]
 1995  mg/day                                      (59%) than T102/T102 (16%) and C102/C102
                                                   (25%) in Schizophrenia patients
 Souza et al.,   HRT3A rs1062613  140  Caucasian and African   NA  At least 6   BPRS  -HRT3A rs1062613 associated with CLZ response
 [76]
 2010  American   months                           (adjusted P = 0.041).
                                                   -A-C-C haplotype of rs2276302-rs1062613-
                                                   rs1150226 was associated with better CLZ
                                                   response (adjusted P = 0.04)
 Rajkumar et al.,   HTR3A rs1062613,   101  Indian   Mean dose: 304.84 ±   At least 12-  BPRS  -T allele of rs1062613 and G allele of rs2276302
 [77]
 2012  rs2276302  119.04 mg/day  weeks             associated with CLZ response (P = 0.02)
                                                   -Combined clinical predictors and HTR3A
                                                   markers explained 38 % variability in CLZ
                                                   response
 Kohlrausch et al.,  SLC6A4 HTTLPR/rs25531  116  Brazilian (European   Average dose = 540.91  At least 3   BPRS  HTTLPR/rs25531 with SO/SO or SO/LO
 [78]
 2010  background)  months                         genotypes associated with CLZ nonresponse (P =
                                                   0.01) and LO/LO with CLZ response (P = 0.04)
 [79]
 Yu et al., 1999  HTR6 267T  99  Chinese   Mean dose: 271.6 mg/day   At least 8 weeks BPRS  HTR6 267T/T genotype had a better CLZ
 for 267C/C, 287.5 mg/day                          response than T/C or C/C groups
 for 267C/T, and 241.7
 mg/day for 267T/T
 Sodhi et al.,   HTR2C Cys23Ser (rs6318)  162  Caucasian   Dose range = 125-600   At least 3   GAS  Patients with one or more 5HT2C ser alleles were
 [80]
 1995  mg/day   months                             clozapine responders (P = 0.005)
 Combinatorial Genetic Assays to Predict Clozapine Response

 Arranz et al.,   HTR2A    200  Caucasian   NA  NA  GAS  -Six polymorphisms 5-HT2A 102-T/C,
 [81]
 2000  -102-T/C                                    His452Tyr, -1438-G/A, 5-HT2C _330-GT/244-
 -1438-G/A                                         CT, Cys23Ser, 5-HTTLPR, and H2 1018-G/A)
 -His452Tyr                                        showed the strongest association with CLZ
 HTR2C                                             response (P < 0·09) and PPV of 76·86% (P =
 -330-GT/-244-CT                                   0·0001).
 -Cys23Ser                                         -Strongest correlations with 5-HT2A 102-T/C,
 5HTLLPR                                           and -1438-G/A,
 -H2 -1018-G/A
 Hwang et al.,   In Caucasians   232  Caucasians and African   NA  At least 6   BPRS  In Caucasians, strongest gene interactions
 [82]
 2011  -DRD1 rs686 and DRD3   Americans   months   observed between DRD1 rs686 and DRD3 Ser9Gly
 Ser9Gly                                           (P = 0.048), followed by DRD2 TaqIB and DRD3
 -DRD2 TaqIB and DRD3                              rs2134655 (P = 0.037), and DRD2 TaqIA & DRD3
 rs2134655                                         rs2134655 (P = 0.040) for BPRS change; & DRD1