
Page 11 - Read Online
P. 11
Comertpay et al. J Transl Genet Genom 2022;6:84-94 https://dx.doi.org/10.20517/jtgg.2021.44 Page 90
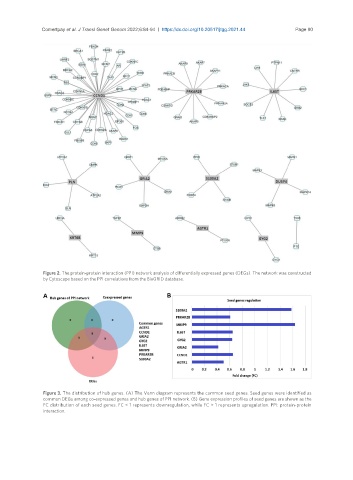
Figure 2. The protein-protein interaction (PPI) network analysis of differentially expressed genes (DEGs). The network was constructed
by Cytoscape based on the PPI correlations from the BioGRID database.
Figure 3. The distribution of hub genes. (A) The Venn diagram represents the common seed genes. Seed genes were identified as
common DEGs among co-expressed genes and hub genes of PPI network. (B) Gene expression profiles of seed genes are shown as the
FC distribution of each seed genes. FC < 1 represents downregulation, while FC > 1 represents upregulation. PPI: protein-protein
interaction.