
Page 62 - Read Online
P. 62
Page 192 Feusier et al. J Transl Genet Genom 2021;5:189-99 https://dx.doi.org/10.20517/jtgg.2021.05
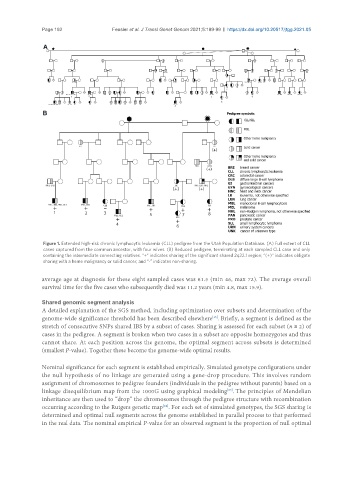
Figure 1. Extended high-risk chronic lymphocytic leukemia (CLL) pedigree from the Utah Population Database. (A) Full extent of CLL
cases captured from the common ancestor, with four wives. (B) Reduced pedigree, terminating at each sampled CLL case and only
containing the intermediate connecting relatives. “+” indicates sharing of the significant shared 2q22.1 region; “(+)” indicates obligate
sharing with a heme malignancy or solid cancer; and “-” indicates non-sharing.
average age at diagnosis for these eight sampled cases was 61.5 (min 46, max 72). The average overall
survival time for the five cases who subsequently died was 11.2 years (min 4.8, max 15.9).
Shared genomic segment analysis
A detailed explanation of the SGS method, including optimization over subsets and determination of the
genome-wide significance threshold has been described elsewhere . Briefly, a segment is defined as the
[15]
stretch of consecutive SNPs shared IBS by a subset of cases. Sharing is assessed for each subset (n ≥ 2) of
cases in the pedigree. A segment is broken when two cases in a subset are opposite homozygotes and thus
cannot share. At each position across the genome, the optimal segment across subsets is determined
(smallest P-value). Together these become the genome-wide optimal results.
Nominal significance for each segment is established empirically. Simulated genotype configurations under
the null hypothesis of no linkage are generated using a gene-drop procedure. This involves random
assignment of chromosomes to pedigree founders (individuals in the pedigree without parents) based on a
linkage disequilibrium map from the 1000G using graphical modeling . The principles of Mendelian
[23]
inheritance are then used to “drop” the chromosomes through the pedigree structure with recombination
[24]
occurring according to the Rutgers genetic map . For each set of simulated genotypes, the SGS sharing is
determined and optimal null segments across the genome established in parallel process to that performed
in the real data. The nominal empirical P-value for an observed segment is the proportion of null optimal