
Page 81 - Read Online
P. 81
Page 32 Pandey et al. J Transl Genet Genom 2021;5:22-36 I http://dx.doi.org/10.20517/jtgg.2020.45
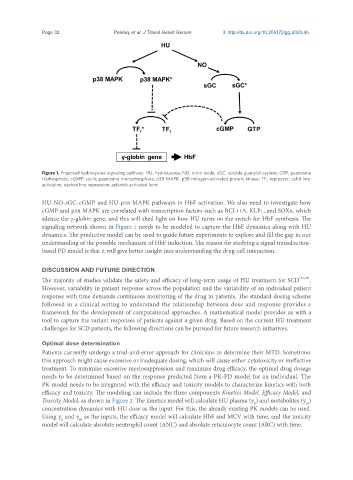
Figure 1. Proposed hydroxyurea signaling pathway. HU: hydroxyurea; NO: nitric oxide; sGC: soluble guanylyl cyclase; GTP: guanosine
triphosphate; cGMP: cyclic guanosine monophosphate; p38 MAPK: p38 mitogen-activated protein kinase; TF r : repressor; solid line:
activation; dashed line: repression; asterisk: activated form
HU-NO-sGC-cGMP and HU-p38 MAPK pathways in HbF activation. We also need to investigate how
cGMP and p38 MAPK are correlated with transcription factors such as BCL11A, KLF1, and SOX6, which
silence the γ-globin gene, and this will shed light on how HU turns on the switch for HbF synthesis. The
signaling network shown in Figure 1 needs to be modeled to capture the HbF dynamics along with HU
dynamics. The predictive model can be used to guide future experiments to explore and fill the gap in our
understanding of the possible mechanism of HbF induction. The reason for studying a signal transduction-
based PD model is that it will give better insight into understanding the drug-cell interaction.
DISCUSSION AND FUTURE DIRECTION
The majority of studies validate the safety and efficacy of long-term usage of HU treatment for SCD [25,26] .
However, variability in patient response across the population and the variability of an individual patient
response with time demands continuous monitoring of the drug in patients. The standard dosing scheme
followed in a clinical setting to understand the relationship between dose and response provides a
framework for the development of computational approaches. A mathematical model provides us with a
tool to capture the variant responses of patients against a given drug. Based on the current HU treatment
challenges for SCD patients, the following directions can be pursued for future research initiatives.
Optimal dose determination
Patients currently undergo a trial-and-error approach for clinicians to determine their MTD. Sometimes
this approach might cause excessive or inadequate dosing, which will cause either cytotoxicity or ineffective
treatment. To minimize excessive myelosuppression and maximize drug efficacy, the optimal drug dosage
needs to be determined based on the response predicted from a PK-PD model for an individual. The
PK model needs to be integrated with the efficacy and toxicity models to characterize kinetics with both
efficacy and toxicity. The modeling can include the three components Kinetics Model, Efficacy Model, and
Toxicity Model, as shown in Figure 2. The kinetics model will calculate HU plasma (y ) and metabolites (y )
m
p
concentration dynamics with HU dose as the input. For this, the already existing PK models can be used.
Using y and y as the inputs, the efficacy model will calculate HbF and MCV with time, and the toxicity
m
p
model will calculate absolute neutrophil count (ANC) and absolute reticulocyte count (ARC) with time.