
Page 80 - Read Online
P. 80
Pandey et al. J Transl Genet Genom 2021;5:22-36 I http://dx.doi.org/10.20517/jtgg.2020.45 Page 31
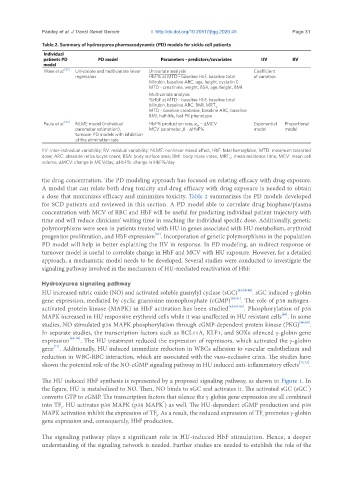
Table 2. Summary of hydroxyurea pharmacodynamic (PD) models for sickle cell patients
Individual
patients PD PD model Parameters - predictors/covariates IIV RV
model
Ware et al. [32] Univariate and multivariate linear Univariate analysis Coefficient
regression HbF% at MTD - baseline HbF, baseline total of variation
bilirubin, baseline ARC, age, height, cystatin C
MTD - creatinine, weight, BSA, age, height, BMI
Multivariate analysis
%HbF at MTD - baseline HbF, baseline total
bilirubin, baseline ARC, BMI, MRT ∞
MTD - baseline creatinine, baseline ARC, baseline
BMI, half-life, fast PK phenotype
Paule et al. [33] NLME model (individual HbF% production rate, k in – ΔMCV Exponential Proportional
parameter estimation), MCV parameter, β - ΔHbF% model model
turnover PD models with inhibition
of the elimination rate
IIV: inter-individual variability; RV: residual variability; NLME: nonlinear mixed effect; HbF: fetal hemoglobin; MTD: maximum tolerated
dose; ARC: absolute reticulocyte count; BSA: body surface area; BMI: body mass index; MRT ∞ : mean residence time; MCV: mean cell
volume; ΔMCV: change in MCV/day; ΔHbF%: change in HbF%/day
the drug concentration. The PD modeling approach has focused on relating efficacy with drug exposure.
A model that can relate both drug toxicity and drug efficacy with drug exposure is needed to obtain
a dose that maximizes efficacy and minimizes toxicity. Table 2 summarizes the PD models developed
for SCD patients and reviewed in this section. A PD model able to correlate drug biophase/plasma
concentration with MCV of RBC and HbF will be useful for predicting individual patient trajectory with
time and will reduce clinicians’ waiting time in reaching the individual specific dose. Additionally, genetic
polymorphisms were seen in patients treated with HU in genes associated with HU metabolism, erythroid
[57]
progenitor proliferation, and HbF expression . Incorporation of genetic polymorphisms in the population
PD model will help in better explaining the IIV in response. In PD modeling, an indirect response or
turnover model is useful to correlate change in HbF and MCV with HU exposure. However, for a detailed
approach, a mechanistic model needs to be developed. Several studies were conducted to investigate the
signaling pathway involved in the mechanism of HU-mediated reactivation of HbF.
Hydroxyurea signaling pathway
HU increased nitric oxide (NO) and activated soluble guanylyl cyclase (sGC) [43,58-60] . sGC induced γ-globin
gene expression, mediated by cyclic guanosine monophosphate (cGMP) [44,61] . The role of p38 mitogen-
activated protein kinase (MAPK) in HbF activation has been studied [45,62-64] . Phosphorylation of p38
MAPK increased in HU responsive erythroid cells while it was unaffected in HU resistant cells . In some
[65]
studies, NO stimulated p38 MAPK phosphorylation through cGMP-dependent protein kinase (PKG) [66,67] .
In separate studies, the transcription factors such as BCL11A, KLF1, and SOX6 silenced γ-globin gene
expression [68-70] . The HU treatment reduced the expression of repressors, which activated the γ-globin
gene . Additionally, HU induced immediate reduction in WBCs adhesion to vascular endothelium and
[71]
reduction in WBC-RBC interaction, which are associated with the vaso-occlusive crisis. The studies have
shown the potential role of the NO-cGMP signaling pathway in HU induced anti-inflammatory effects [72,73] .
The HU induced HbF synthesis is represented by a proposed signaling pathway, as shown in Figure 1. In
*
the figure, HU is metabolized to NO. Then, NO binds to sGC and activates it. The activated sGC (sGC )
converts GTP to cGMP. The transcription factors that silence the γ-globin gene expression are all combined
*
into TF. HU activates p38 MAPK (p38 MAPK ) as well. The HU-dependent cGMP production and p38
r
MAPK activation inhibit the expression of TF. As a result, the reduced expression of TF promotes γ-globin
r
r
gene expression and, consequently, HbF production.
The signaling pathway plays a significant role in HU-induced HbF stimulation. Hence, a deeper
understanding of the signaling network is needed. Further studies are needed to establish the role of the