
Page 78 - Read Online
P. 78
Pandey et al. J Transl Genet Genom 2021;5:22-36 I http://dx.doi.org/10.20517/jtgg.2020.45 Page 29
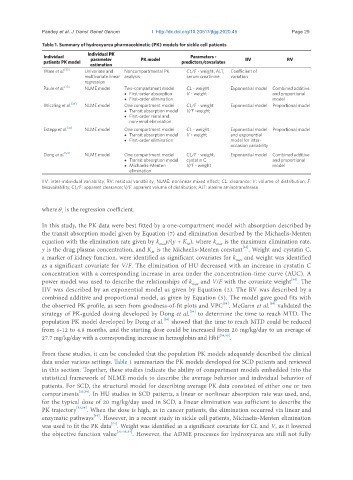
Table 1. Summary of hydroxyurea pharmacokinetic (PK) models for sickle cell patients
Individual Individual PK Parameters -
patients PK model parameter PK model predictors/covariates IIV RV
estimation
Ware et al. [32] Univariate and Noncompartmental PK CL/F - weight, ALT, Coefficient of
multivariate linear analysis serum creatinine variation
regression
Paule et al. [33] NLME model Two-compartment model CL - weight Exponential model Combined additive
• First-order absorption V - weight and proportional
• First-order elimination model
Wiczling et al. [34] NLME model One compartment model CL/F - weight Exponential model Proportional model
• Transit absorption model V/F -weight
• First-order renal and
non-renal elimination
Estepp et al. [35] NLME model One compartment model CL - weight Exponential model Proportional model
• Transit absorption model V - weight and exponential
• First-order elimination model for inter-
occasion variability
Dong et al. [54] NLME model One compartment model CL/F - weight, Exponential model Combined additive
• Transit absorption model cystatin C and proportional
• Michaelis-Menten V/F - weight model
elimination
IIV: inter-individual variability; RV: residual variability; NLME: nonlinear mixed effect; CL: clearance; V: volume of distribution; F:
bioavailability; CL/F: apparent clearance; V/F: apparent volume of distribution; ALT: alanine aminotransferase
where θ is the regression coefficient.
1
In this study, the PK data were best fitted by a one-compartment model with absorption described by
the transit absorption model given by Equation (7) and elimination described by the Michaelis-Menten
equation with the elimination rate given by k y/(y + K ), where k is the maximum elimination rate,
M
max
max
[54]
y is the drug plasma concentration, and K is the Michaelis-Menten constant . Weight and cystatin C,
M
a marker of kidney function, were identified as significant covariates for k and weight was identified
max
as a significant covariate for V/F. The elimination of HU decreased with an increase in cystatin C
concentration with a corresponding increase in area under the concentration-time curve (AUC). A
[54]
power model was used to describe the relationships of k and V/F with the covariate weight . The
max
IIV was described by an exponential model as given by Equation (2). The RV was described by a
combined additive and proportional model, as given by Equation (5). The model gave good fits with
[54]
[55]
the observed PK profile, as seen from goodness-of-fit plots and VPC . McGann et al. validated the
[54]
strategy of PK-guided dosing developed by Dong et al. to determine the time to reach MTD. The
[54]
population PK model developed by Dong et al. showed that the time to reach MTD could be reduced
from 6-12 to 4.8 months, and the starting dose could be increased from 20 mg/kg/day to an average of
27.7 mg/kg/day with a corresponding increase in hemoglobin and HbF [54,55] .
From these studies, it can be concluded that the population PK models adequately described the clinical
data under various settings. Table 1 summarizes the PK models developed for SCD patients and reviewed
in this section. Together, these studies indicate the ability of compartment models embedded into the
statistical framework of NLME models to describe the average behavior and individual behavior of
patients. For SCD, the structural model for describing average PK data consisted of either one or two
compartments [33,34] . In HU studies in SCD patients, a linear or nonlinear absorption rate was used, and,
for the typical dose of 20 mg/kg/day used in SCD, a linear elimination was sufficient to describe the
PK trajectory [33,34] . When the dose is high, as in cancer patients, the elimination occurred via linear and
[19]
enzymatic pathways . However, in a recent study in sickle cell patients, Michaelis-Menten elimination
was used to fit the PK data . Weight was identified as a significant covariate for CL and V, as it lowered
[54]
the objective function value [32-35,54] . However, the ADME processes for hydroxyurea are still not fully