
Page 95 - Read Online
P. 95
Cendrós et al. J Transl Genet Genom 2020;4:210-20 I http://dx.doi.org/10.20517/jtgg.2020.21 Page 215
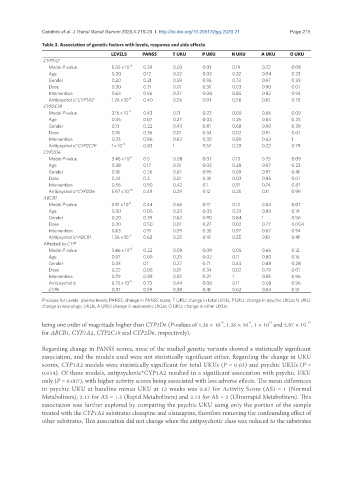
Table 3. Association of genetic factors with levels, response and side effects
LEVELS PANSS T UKU P UKU N UKU A UKU O UKU
CYP1A2
Model P-value 5.05 x 10 -8 0.39 0.03 0.01 0.19 0.72 0.08
Age 0.30 0.12 0.22 0.03 0.32 0.94 0.23
Gender 0.20 0.21 0.59 0.92 0.73 0.97 0.39
Dose 0.30 0.31 0.01 0.31 0.03 0.90 0.01
Intervention 0.63 0.96 0.37 0.08 0.85 0.82 0.94
Antipsychotic*CYP1A2 1.26 x 10 -9 0.40 0.06 0.01 0.58 0.10 0.75
CYP2C19
Model P-value 3.16 x 10 -8 0.43 0.11 0.22 0.09 0.86 0.09
Age 0.45 0.07 0.27 0.03 0.25 0.84 0.25
Gender 0.13 0.22 0.43 0.81 0.68 0.90 0.39
Dose 0.18 0.36 0.01 0.34 0.02 0.91 0.01
Intervention 0.33 0.86 0.63 0.30 0.89 0.63 1
Antipsychotic*CYP2C19 1 x 10 -9 0.83 1 0.57 0.29 0.22 0.79
CYP2D6
Model P-value 3.46 x 10 -8 0.5 0.08 0.07 0.13 0.75 0.09
Age 0.38 0.17 0.19 0.03 0.28 0.97 0.23
Gender 0.18 0.26 0.61 0.95 0.69 0.97 0.41
Dose 0.24 0.3 0.01 0.31 0.03 0.85 0.01
Intervention 0.56 0.90 0.42 0.1 0.91 0.74 0.87
Antipsychotic*CYP2D6 5.97 x 10 -10 0.49 0.29 0.12 0.25 0.11 0.99
ABCB1
Model P-value 3.81 x 10 -8 0.44 0.66 0.17 0.12 0.84 0.07
Age 0.30 0.06 0.20 0.03 0.33 0.85 0.19
Gender 0.20 0.33 0.62 0.90 0.84 1 0.56
Dose 0.30 0.50 0.01 0.27 0.02 0.77 0.004
Intervention 0.63 0.91 0.59 0.35 0.97 0.67 0.94
Antipsychotic*ABCB1 1.26 x 10 -9 0.63 0.25 0.19 0.55 0.19 0.41
Affected by CYP
Model P-value 3.46 x 10 -8 0.22 0.09 0.09 0.05 0.66 0.12
Age 0.97 0.09 0.25 0.02 0.11 0.80 0.16
Gender 0.33 0.1 0.27 0.71 0.43 0.88 0.28
Dose 0.22 0.06 0.01 0.34 0.02 0.79 0.01
Intervention 0.79 0.89 0.52 0.21 1 0.55 0.96
Antipsychotic 6.75 x 10 -11 0.73 0.44 0.08 0.11 0.08 0.96
CYPs 0.37 0.59 0.38 0.41 0.62 0.84 0.51
P-values for Levels: plasma levels, PANSS: change in PANSS score; T UKU: change in total UKUs, P UKU: change in psychic UKUs; N UKU:
change in neurologic UKUs, A UKU: change in autonomic UKUs; O UKU: change in other UKUs
-10
-9
-9
-9
being one order of magnitude higher than CYP2D6 (P-values of 1.26 × 10 , 1.26 × 10 , 1 × 10 and 5.97 × 10
for ABCB1, CYP1A2, CYP2C19 and CYP2D6, respectively).
Regarding change in PANSS scores, none of the studied genetic variants showed a statistically significant
association, and the models used were not statistically significant either. Regarding the change in UKU
scores, CYP1A2 models were statistically significant for total UKUs (P = 0.03) and psychic UKUs (P =
0.014). Of these models, antipsychotic*CYP1A2 resulted in a significant association with psychic UKU
only (P = 0.007), with higher activity scores being associated with less adverse effects. The mean differences
in psychic UKU at baseline minus UKU at 12 weeks was 0.67 for Activity Score (AS) = 1 (Normal
Metabolizers), 2.12 for AS = 1.5 (Rapid Metabolizers) and 2.13 for AS = 2 (Ultrarrapid Metabolizers). This
association was further explored by comparing the psychic UKU using only the portion of the sample
treated with the CYP1A2 substrates clozapine and olanzapine, therefore removing the confounding effect of
other substrates. This association did not change when the antipsychotic class was reduced to the substrates