
Page 94 - Read Online
P. 94
Page 214 Cendrós et al. J Transl Genet Genom 2020;4:210-20 I http://dx.doi.org/10.20517/jtgg.2020.21
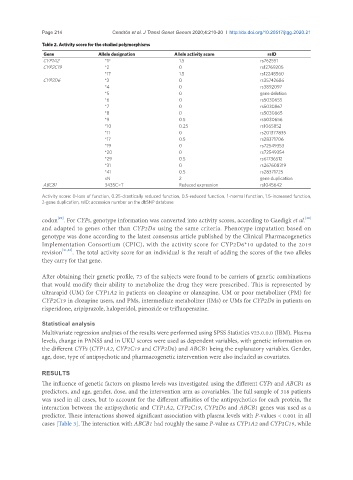
Table 2. Activity score for the studied polymorphisms
Gene Allele designation Allele activity score rsID
CYP1A2 *1F 1.5 rs762551
CYP2C19 *2 0 rs12769205
*17 1.5 rs12248560
CYP2D6 *3 0 rs35742686
*4 0 rs3892097
*5 0 gene deletion
*6 0 rs5030655
*7 0 rs5030867
*8 0 rs5030865
*9 0.5 rs5030656
*10 0.25 rs1065852
*11 0 rs201377835
*17 0.5 rs28371706
*19 0 rs72549353
*20 0 rs72549354
*29 0.5 rs61736512
*31 0 rs267608319
*41 0.5 rs28371725
xN 2 gene duplication
ABCB1 3435C>T Reduced expression rs1045642
Activity score: 0-loss of function, 0.25-drastically reduced function, 0.5-reduced function, 1-normal function, 1.5-increased function,
2-gene duplication, rsID: accession number on the dbSNP database
[29]
codon . For CYPs, genotype information was converted into activity scores, according to Gaedigk et al.
[30]
and adapted to genes other than CYP2D6 using the same criteria. Phenotype imputation based on
genotype was done according to the latest consensus article published by the Clinical Pharmacogenetics
Implementation Consortium (CPIC), with the activity score for CYP2D6*10 updated to the 2019
revision [31,32] . The total activity score for an individual is the result of adding the scores of the two alleles
they carry for that gene.
After obtaining their genetic profile, 73 of the subjects were found to be carriers of genetic combinations
that would modify their ability to metabolize the drug they were prescribed. This is represented by
ultrarapid (UM) for CYP1A2 in patients on clozapine or olanzapine, UM or poor metabolizer (PM) for
CYP2C19 in clozapine users, and PMs, intermediate metabolizer (IMs) or UMs for CYP2D6 in patients on
risperidone, aripiprazole, haloperidol, pimozide or trifluoperazine.
Statistical analysis
Multivariate regression analyses of the results were performed using SPSS Statistics v23.0.0.0 (IBM). Plasma
levels, change in PANSS and in UKU scores were used as dependent variables, with genetic information on
the different CYPs (CYP1A2, CYP2C19 and CYP2D6) and ABCB1 being the explanatory variables. Gender,
age, dose, type of antipsychotic and pharmacogenetic intervention were also included as covariates.
RESULTS
The influence of genetic factors on plasma levels was investigated using the different CYPs and ABCB1 as
predictors, and age, gender, dose, and the intervention arm as covariables. The full sample of 318 patients
was used in all cases, but to account for the different affinities of the antipsychotics for each protein, the
interaction between the antipsychotic and CYP1A2, CYP2C19, CYP2D6 and ABCB1 genes was used as a
predictor. These interactions showed significant association with plasma levels with P-values < 0.001 in all
cases [Table 3]. The interaction with ABCB1 had roughly the same P-value as CYP1A2 and CYP2C19, while