


Page 67 - Read Online
P. 67
Page 12 of 21                      Wen et al. J. Mater. Inf. 2025, 5, 30  https://dx.doi.org/10.20517/jmi.2024.102


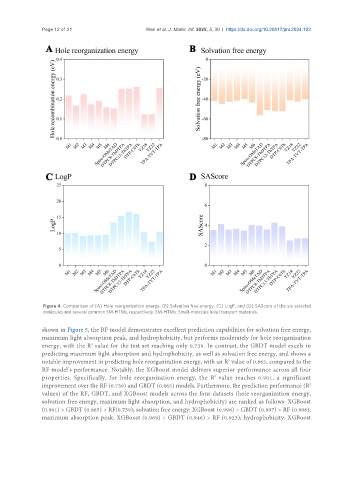
                Figure 4. Comparison of (A) Hole reorganization energy, (B) Solvation free energy, (C) LogP, and (D) SAScore of the six selected
                molecules and several common SM-HTMs, respectively. SM-HTMs: Small-molecule hole transport materials.

               shown in Figure 5, the RF model demonstrates excellent prediction capabilities for solvation free energy,
               maximum light absorption peak, and hydrophobicity, but performs moderately for hole reorganization
               energy, with the R  value for the test set reaching only 0.739. In contrast, the GBDT model excels in
                                2
               predicting maximum light absorption and hydrophobicity, as well as solvation free energy, and shows a
               notable improvement in predicting hole reorganization energy, with an R  value of 0.865, compared to the
                                                                              2
               RF model’s performance. Notably, the XGBoost model delivers superior performance across all four
                                                                         2
               properties. Specifically, for hole reorganization energy, the R  value reaches 0.901, a significant
               improvement over the RF (0.739) and GBDT (0.865) models. Furthermore, the prediction performance (R
                                                                                                         2
               values) of the RF, GBDT, and XGBoost models across the four datasets (hole reorganization energy,
               solvation free energy, maximum light absorption, and hydrophobicity) are ranked as follows: XGBoost
               (0.901) > GBDT (0.865) > RF(0.739); solvation free energy: XGBoost (0.998) > GBDT (0.997) > RF (0.996);
               maximum absorption peak: XGBoost (0.969) > GBDT (0.946) > RF (0.923); hydrophobicity: XGBoost

