


Page 60 - Read Online
P. 60
Wen et al. J. Mater. Inf. 2025, 5, 30  https://dx.doi.org/10.20517/jmi.2024.102  Page 5 of 21


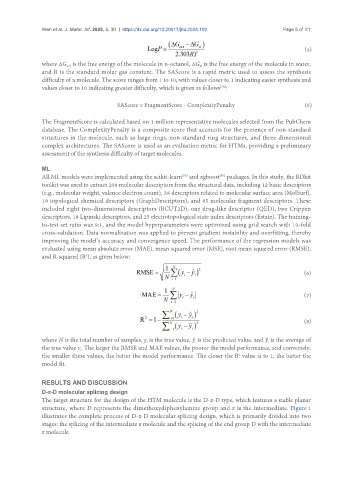
                                                                                                        (4)

               where ΔG  is the free energy of the molecule in n-octanol, ΔG  is the free energy of the molecule in water,
                                                                    w
                       oct
               and R is the standard molar gas constant. The SAScore is a rapid metric used to assess the synthesis
               difficulty of a molecule. The score ranges from 1 to 10, with values closer to 1 indicating easier synthesis and
               values closer to 10 indicating greater difficulty, which is given as follows :
                                                                           [54]
                                         SAScore = FragmentScore - ComplexityPenalty                                                (5)


               The FragmentScore is calculated based on 1 million representative molecules selected from the PubChem
               database. The ComplexityPenalty is a composite score that accounts for the presence of non-standard
               structures in the molecule, such as large rings, non-standard ring structures, and three-dimensional
               complex architectures. The SAScore is used as an evaluation metric for HTMs, providing a preliminary
               assessment of the synthesis difficulty of target molecules.

               ML
                                                              [55]
                                                                           [56]
               All ML models were implemented using the scikit-learn  and xgboost  packages. In this study, the RDkit
               toolkit was used to extract 208 molecular descriptors from the structural data, including 12 basic descriptors
               (e.g., molecular weight, valence electron count), 38 descriptors related to molecular surface area (MolSurf),
               19 topological chemical descriptors (GraphDescriptors), and 85 molecular fragment descriptors. These
               included eight two-dimensional descriptors (BCUT2D), one drug-like descriptor (QED), two Crippen
               descriptors, 18 Lipinski descriptors, and 25 electrotopological state index descriptors (Estate). The training-
               to-test set ratio was 9:1, and the model hyperparameters were optimized using grid search with 10-fold
               cross-validation. Data normalization was applied to prevent gradient instability and overfitting, thereby
               improving the model’s accuracy and convergence speed. The performance of the regression models was
               evaluated using mean absolute error (MAE), mean squared error (MSE), root mean squared error (RMSE),
               and R-squared (R ), as given below:
                              2

                                                                                                        (6)


                                                                                                        (7)


                                                                                                        (8)


               where N is the total number of samples, y is the true value, y is the predicted value, and y is the average of
                                                  i
                                                                                           i
                                                                   i
               the true value y. The larger the RMSE and MAE values, the poorer the model performance, and conversely,
                            i
               the smaller these values, the better the model performance. The closer the R  value is to 1, the better the
                                                                                 2
               model fit.
               RESULTS AND DISCUSSION
               D-π-D molecular splicing design
               The target structure for the design of the HTM molecule is the D-π-D type, which features a stable planar
               structure, where D represents the dimethoxydiphenylamine group and π is the intermediate. Figure 1
               illustrates the complete process of D-π-D molecular splicing design, which is primarily divided into two
               stages: the splicing of the intermediate π molecule and the splicing of the end group D with the intermediate
               π molecule.

